![]()
Greetings, fellow data analysts!
Artists who present their works as “Untitled” usually have their reasons which we as observers can only speculate. Perhaps, the viewers should reflect the work without being biased or distracted by the description. Maybe, the artist just doesn’t want to come across as condescending. Then again, the nameless title could also be part of the concept. And, of course, there is always the possibility that the author couldn’t think of anything more suitable.
Yes, there are many open questions in the field of fine arts that lead to interesting discussions. However, this does not apply when we switch the genre to the art of data analysis. Each work should contain a short, suitable title and description. The key here is to find the right balance. An “Untitled” report is just as inappropriate as loquacious descriptions a la F. Scott Fitzgerald.
DeltaMaster has built-in tools to edit report descriptions and to adapt them to their viewers. We will present a few of these options in this edition of clicks! How you apply them is an art all of its own.
Best regards,
Your Bissantz & Company Team
Good reports clearly show what their numbers are referencing. This not only ensures that the readers truly understand them and can interpret them correctly but also eliminates misunderstandings and boring discussions on the data in question. Although the labeling should include all important information, it should also be clear enough so that readers can quickly see 1.) What the report shows, 2.) What is interesting about it, and 3.) How it differs from others.
In DeltaMaster you can see what information a report contains in two places: The most obvious is in the report itself, where we can see which measures, hierarchies, levels and members are displayed, what the rows and columns contain, etc. The other alternative is to look at the report view. This combination of selected members (e.g. limitations, filters), which is displayed “outside” of the report in the My view window, explains the context of that particular report.
In a future edition of clicks!, we will explain how you can design labels within a report. This time, however, we will show you some helpful tips and tricks for fine tuning the description of report views.
Omnipresent: View descriptions
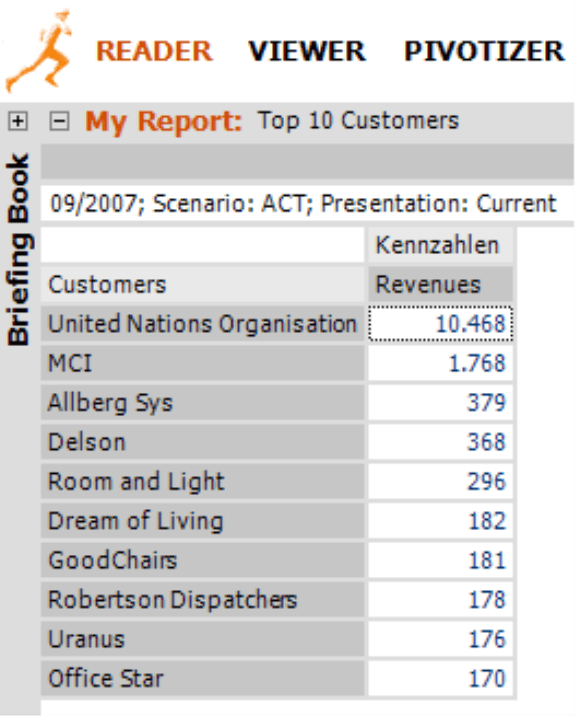
View descriptions summarize which members are currently selected in the underlying report. These descriptions are present throughout DeltaMaster. In Reader mode, you can find them directly above the reports in their own row below the dark gray to tool bar. At the very top behind My report, you can see the report name as it was saved in the briefing book.
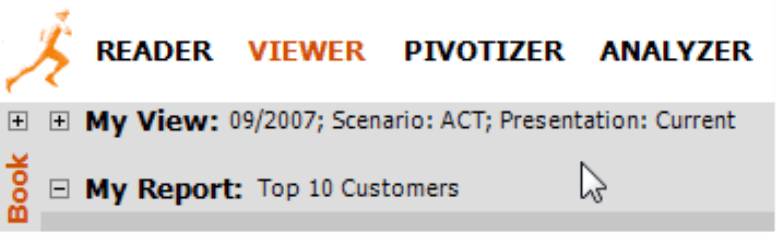
In all other levels, you can see the view description in the toolbar of the My view window. In Miner mode, the view description is also shown in the History window – but more on this later.
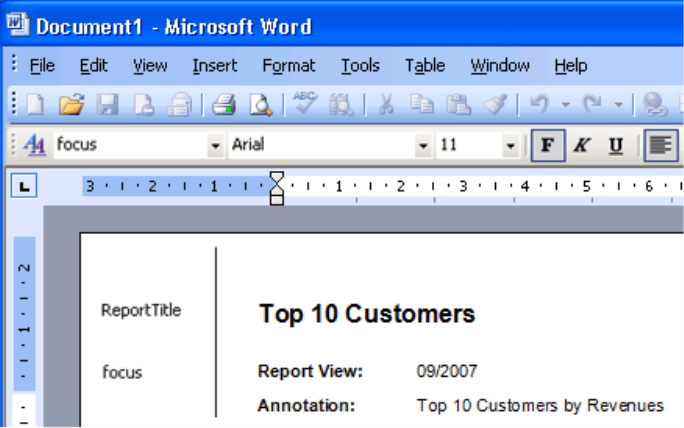
When you export a report to Microsoft Office or an HTML file, the new file will also contain the view description.
Creating view descriptions
The view description is a string which DeltaMaster automatically generates based on a series of rules.
- Generally, the view description contains all dimensions that have more than one member and a selection other than the top member. If the view, therefore, shows “All customers“, “All products”, or “All companies”, DeltaMaster will not create an entry to ensure that the description is as short and meaningful as possible. It only points out specifics or limitations.
- Due to this logic, view descriptions often contain flat dimensions that do not contain a top member, for example, value types with “PLAN” or “BUD” which cannot be aggregated.
- The order in the view description depends on the order of the dimensions in the My view window. As a result, many users arrange their dimensions so that “Time” is positioned at the top. Since this is a very important attribute, it makes sense to place it at the front of the view description. In order to sort dimensions in the My view window, press the Alt key while using your mouse to drag and drop the dimensions. If you make any changes, you will only be able to see them after you refresh (F9 key) your report.
- For each dimension included, DeltaMaster will generally display the selected member, including the name of the level on which it is located, into the description. The time dimension, however, is different. Since time information (e.g. “October 2008”) is usually clear from the start, DeltaMaster automatically suppresses the level (in this case, “Month”) in the default setting.
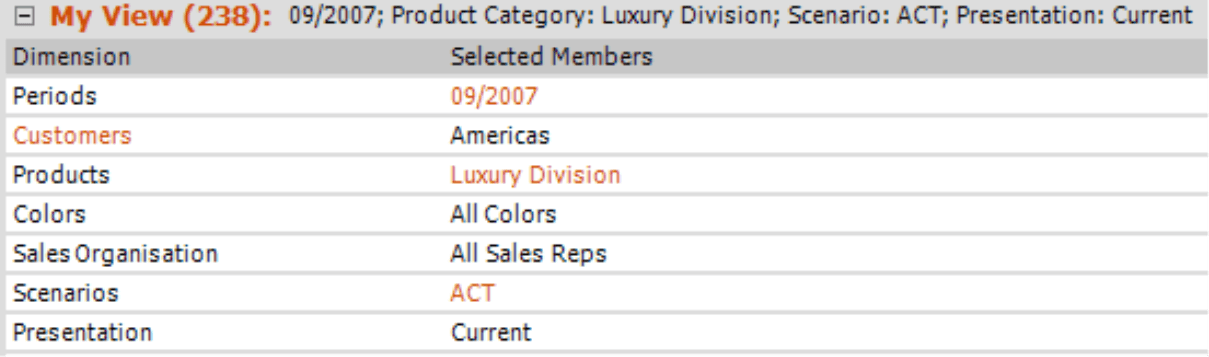
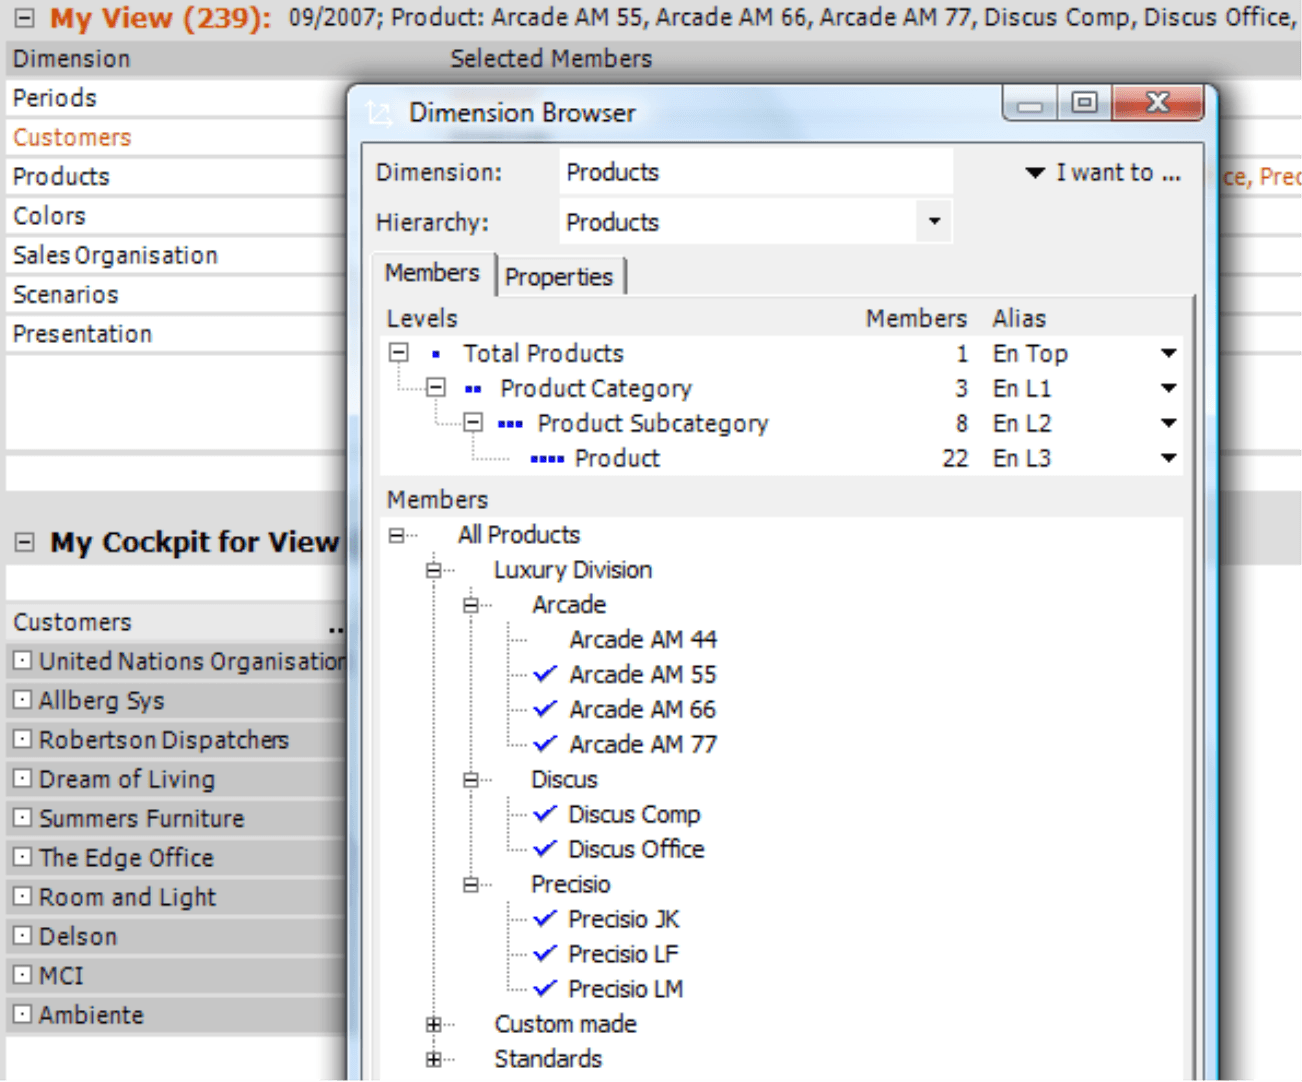
Keeping these rules in mind, you can quickly understand how DeltaMaster created the view description shown in the screenshot on your right. It starts with the selected period “09/2007“, because this is the first dimension. Since it also is the time dimension, the description “Month:“ was automatically eliminated. “Customers” is also missing because no particular members were selected (i.e. “Americas” is the top member). Since the products were limited to the “Luxury division” product category, however, this is noted in the description. “All colors” and “All sales reps” are also missing because the top member is selected. Since the scenarios (ACT, BUD, etc.) and the presentation (e.g. “Current”, “Previous period”) have no top member, this counts as something relevant in the description.
In models with many dimensions and reports with many selected members, the view description can become lengthy. This makes it more difficult to understand, and not every dimension is relevant in every report. To ensure that we quickly know what is important as well as how it differs in general and in comparison to other reports, DeltaMaster offers different ways to shorten the view description.
Omitting what’s obvious
Let’s take another look at the screenshot above. Could “Luxury division” be anything other than a product category? In the case of our reference model, the answer is no. Each employee at Chair AG knows that the product spectrum is broken down into three main groups: “Standards“, “Luxury division”, and “Custom made”. These names do not reoccur under “Customers”, “Colors” and “Sales reps”, in a parallel product hierarchy or anywhere else in the company. Therefore, if you are absolutely certain that there could be no misunderstanding where the luxury models belong, you can eliminate “Product categories” as the level description.
You can quickly remove this name in the Dimension browser. In the context menu of the Levels, there is an entry that controls if DeltaMaster should Show levels in view descriptions (i.e. the default setting for all levels except for time dimensions) or not.
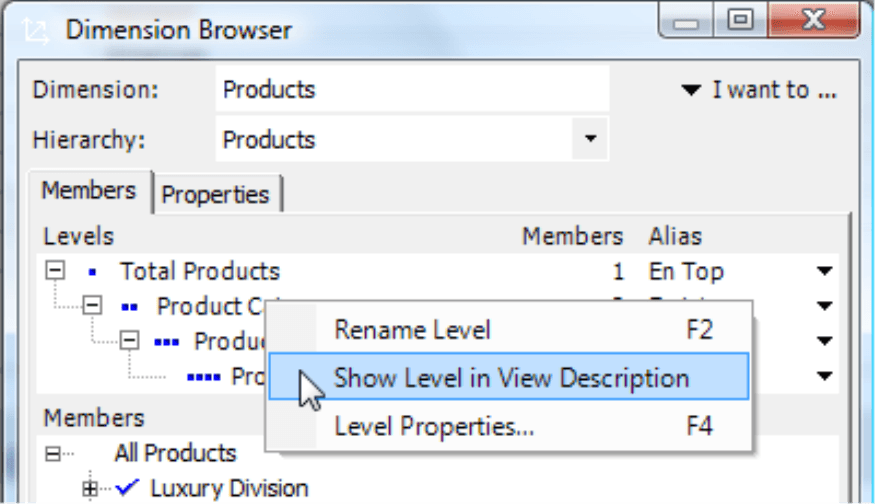
To suppress the “Product category” level names in our example, we can deactivate this option. This immediately improves the readability of the view description in all reports containing information about the product categories. Please note that DeltaMaster hides the name of the level and not the members that are selected on this level. This option, therefore, has no effect on MDX expressions (“{<viewX}“) in the names of reports or folders.
![]()
Removing what’s conventional
Our example has even more cutback potential for “Presentations” and “Scenarios”. Although these flat dimensions have no levels and we, therefore, cannot hide their names, we could eliminate the entire dimension in certain circumstances. This is the case when every reader assumes that a default member applies if nothing else is listed.
Let’s say, for example, that you only report “Revenues: 10 million”. In this case, everyone would generally assume that the report is referring to the actual and not the budget or forecasted revenues. In addition, the reader could expect that this is referring to the currently selected period and not a rolling six-month average.
If all employees share the same basic assumptions, there is no need to repeat this information in every single report. You only need to note varying views.
To hide these types of standard members, you can again use the Dimension browser. The context menu under Members contains an entry that determines if DeltaMaster should Show member in view description (i.e. the default setting) or not. Hiding it in the view description works when the member in question is the only one selected in the dimension. If multiple members such as “ACT” and “BUD” are selected, however, DeltaMaster will display all members to avoid confusion.
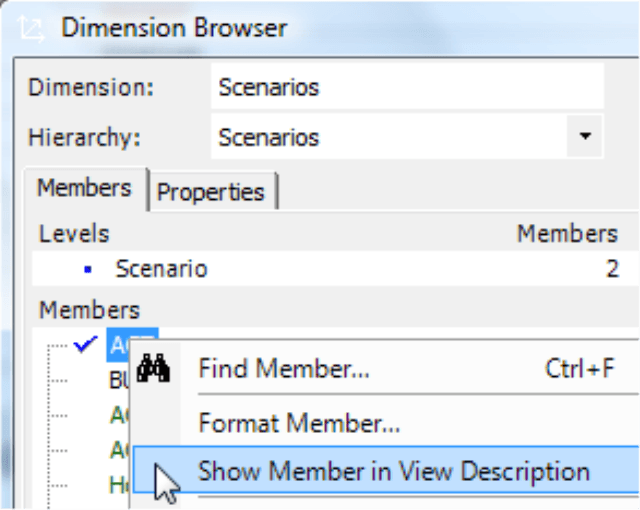
Typical dimensions in which you can hide standard members include scenario (“ACT” for the default setting), presentation (time utility with “Current” as the default setting) or a help axis for accumulations (“Not cumulated” or “Period value” as the default setting). Many applications contain dimensions which we cannot differentiate between a normal case and an exception in some cases. Here, too, there is often a standard that doesn’t require a separate indication.
Using this switch, we have minimized the view description in our example. We can still clearly see what the report is about, and we cannot remove any more information.
![]()
Overwriting descriptions
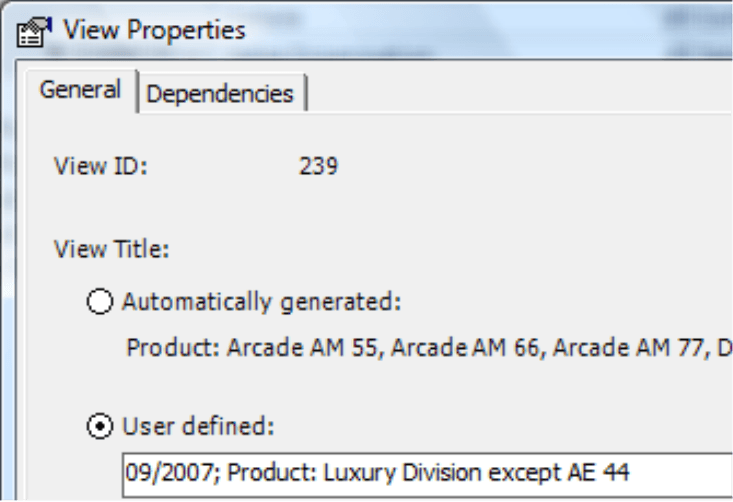
The approach that we described in the past few pages allows you to adapt the automatically generated view descriptions. In certain cases, however, you can also remove the automation completely and create your own view description. This is useful if you have selected a large number of members and would rather like to reword the selection with a shorter, more appropriate name.
For example: An experienced product manager does not need an explicit list of the individually selected luxury products as seen in the screenshot on your right. In this case, the description “Luxury division except AM44” would suffice.
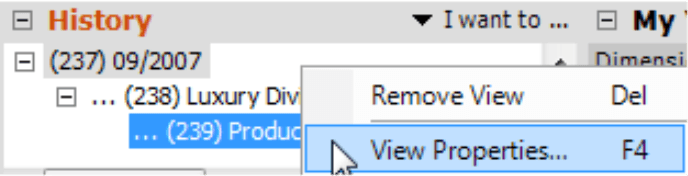
For that purpose, you can also enter a user-defined name for the view under View properties (context menu in the History window).
This name replaces the automatically generated view description throughout the application (i.e. analysis session). If desired, you can easily switch back to the automatically generated view titles at any time.
Questions? Comments?
Just contact your Bissantz team for more information!
