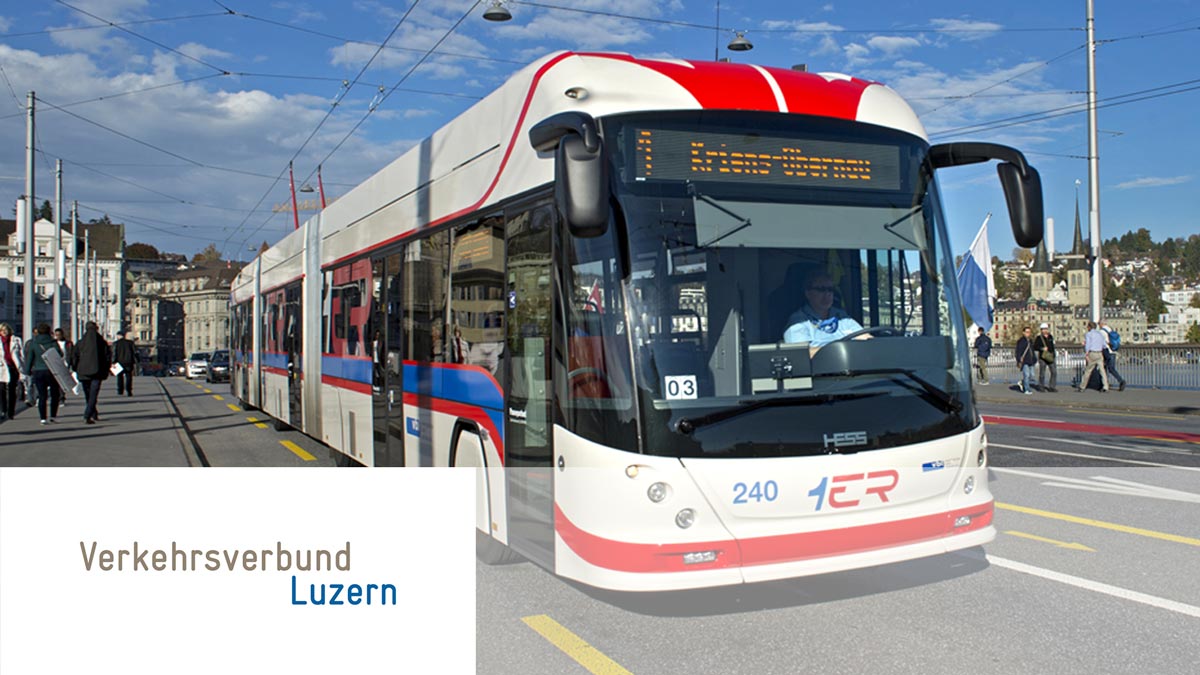
Verkehrsverbund Luzern: Planning, ordering, and financing with DeltaMaster
The Lucerne Regional Transport Association (Verkehrsverbund Luzern, VVL) uses DeltaMaster to analyze data for planning, ordering, and financing in the area of public transport based on a wide range of data on the services offered by the various transport companies, public subsidies, concessions and permits, investment projects and grants, and line and stop data. The results are included in public statistics and half-yearly and annual reports and serve as the basis for negotiations in operating business. They are also used for budgeting and financial planning.
Every year, VVL and the transport companies work together to get more than 100 million passengers to their destinations safely and reliably. The main tasks of VVL are the development of rail and bus services, defining the service range and pricing, and negotiating agreements with the transport companies. VVL also manages the administrative office of the Passepartout tariff association.

Upstream system with many interfaces
The basis for efficient planning, ordering, and financing for public transport is provided by reliable data and evaluations on the 106 lines out of a total of 124 potential service lines and their 936 stops, which are served by 13 transport companies and financed by the federal government, the canton, and 83 municipalities.
VVL uses Beluga, a specialist software product for buyers of public transport services, that it developed in conjunction with the Public Transport Ministry of the Canton of Bern and an IT service provider. The solution
manages the services offered by transport companies, including all cost and income items, quantities, and key performance indicators, and can store offer variants and options and various inter-cantonal allocation formulas. Beluga also provides information on the utilization of subsidies and allows service agreements to be prepared with database support. Additional functions are the administration of concessions and permits, investment projects and grants, and line and stop data.
Flexible reporting with BI
VVL decided to introduce a business intelligence system to improve the flexibility of reporting using the Beluga data. The aim was to ensure reporting can be adapted to new requirements and that the level of detail of the evaluations prepared can be varied. VVL also wanted to be prepared for connecting additional data sources.
It was won over by the DeltaMaster integrated business intelligence software suite from Bissantz. Key factors in VVL‘s decision to opt for DeltaMaster were the sophisticated analysis and visualization functions, which ensure reports and dashboards with a high information density. „I was particularly impressed by the KPI tiles, which provide clear, user-specific starting points for more detailed analysis, as well as the ‘Report Weather’, which uses defined management figures to reflect the main points of a report,“ explains Yvonne Schuler, Deputy Managing Director at VVL.
“DeltaMaster is a flexible tool that allows us to present the most important information simply, connect data from different sources, and zoom from the big picture to the details with just a few clicks.”
Yvonne Schuler, Deputy Managing Director, Verkehrsverbund Luzern
Analysis at the touch of a button
DeltaMaster is used by ten employees in the areas of controlling, finance, ordering, statistics, and monitoring. A dashboard gives the user groups access to reports specially tailored to their requirements. Employees can navigate from an overview to detailed analyses, e.g. drilling down from all transport companies to individual lines.
In areas such as outstanding invoices, order scope, and financing, DeltaMaster is used to answer questions such as:
- How many offers or actual invoices are currently outstanding?
- What offers have been accepted and what is their scope?
- What payments are outstanding? • How has revenue developed?
- What is the variance between the planned order volume and the available budget? How much budget needs to be renegotiated?
- How much have full costs and revenue per transport company and line changed compared with the previous year?
The BI solution also models all of the figures required for the annual report. VVL benefits from quick report preparation and significantly increased transparency, in terms of the volume of information and its comprehensibility. This is paying off in the true sense of the word: “We now have a considerably better negotiating position in discussions with the Administrative Board. When it comes to the funds provided by the canton, for example, I can illustrate how our service offering has developed right down to the smallest detail and present convincing arguments for increased funding,” explains the Deputy Managing Director.
In the future
DeltaMaster will continue to play a key role at VVL, as Yvonne Schuler confirms: “We were surprised to discover all the things we can do with DeltaMaster – and already have a whole range of ideas for the future. We want to combine the internal VVL world, in the shape of Beluga data, with external data in DeltaMaster. Examples include data on ticket sales, demographic data on population development, the number of registered electric bikes and mopeds, the number of free parking spaces, etc. This will provide information on mobility patterns in the canton. In combination with the Beluga data, we intend to use DeltaMaster to gain an insight into what we can do in terms of our product and service range in order to remain competitive, for example.”
Highlights
- Data for 13 transport companies, 124 lines with 936 stops, 83 municipalities, 10 neighboring cantons
- Drill-down from overview to detailed level
- User-group-specific report delivery
- Quicker report preparation Significant increase in information transparency
- Improved negotiating position
Verkehrsverbund Luzern
- Data on 13 transport companies, 124 lines with their 936 stops, 83 municipalities, 10 neighbouring cantons
- Drill-down from the overall view down to the detailed level
- User group-specific report provisioning
- Faster report generation
- Significantly higher information transparency
- Improved negotiating position