Greetings, fellow data analysts!
When you are searching for new insights in data, you sometimes need to draw on new data – data that goes beyond what is offered in a data warehouse and, quite possibly, will only be collected for a specific purpose. For example, you may want to supplement the information that you provide on a regular basis with special analyses that stem from other systems or you might want to include external data, such as raw material prices, weather data, market analyses, or statistics from the internet. In applications that only contain actual data, you may want to add at least the aggregated plan or budget values, for example, for the business units, divisions, or regions. These types of supplementary data are often stored in Excel files. You can easily transfer data in this format to existing DeltaMaster applications. That makes the path from new data to new insights fast and easy! We will explain what you need to know on the following pages.
Best regards,
Your Bissantz & Company team
There are several ways to integrate data from Microsoft Excel in DeltaMaster applications:
a) In the context of automated data provisioning, data from one or more Excel files can be automatically transferred to a data warehouse, where it is linked with data from other systems. In this case, the import from Excel is part of the extraction, transformation, loading process (ETL) and works like transfers from other source systems. Setting up the processing, which takes place outside of DeltaMaster, requires technical skills and permis¬sions. This is typically a job for IT or tech-savvy business users.
b) In self-service applications, an Excel file is the primary data source. DeltaMaster, therefore, does not access the data from a large data warehouse but from the Excel file, which was automatically transformed for this purpose into what is known as a local cube file. Business users can easily create, update, and distribute these types of applications with DeltaMaster. These applications, however, are for self-service scenarios. That means they only support multiple users to a limited degree and are not intended for large data volumes.
c) Aside from the data in a data warehouse, values from Excel can also be loaded into the DeltaMaster application. The primary data source is the data warehouse. In addition, DeltaMaster reads values from one or more Excel files and makes them available as a Measure in the application. Setting this up is simple – even for business users. No changes in the data warehouse are necessary. The application retains its multi-user capabilities.
d) In planning applications, values from Excel can be copied to input masks or even imported row by row from an Excel file. Plan values that were generated in other systems can then be transferred to the central planning processes of DeltaMaster. Planners can run the import on their own, even over the Web. The process of collecting and checking worksheets is no longer a central task and can be delegated to the planners. Only the import procedures need to be set up centrally.
This edition of clicks! will focus on scenario c): transferring values from Excel files to an existing application. Such a combination of data sources is also called a mash-up.
Use case: Sales controlling and CRM
We will explain the procedure based on an example from our “Chair” reference model. We want to extend an existing analysis to show how many calls the respective internal sales team made to specific clients.
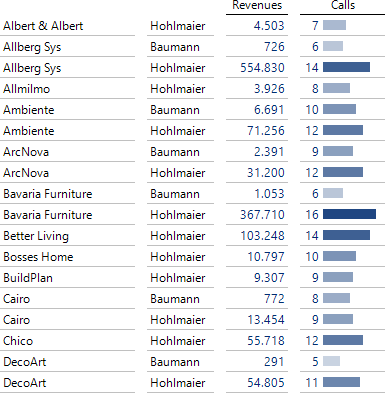
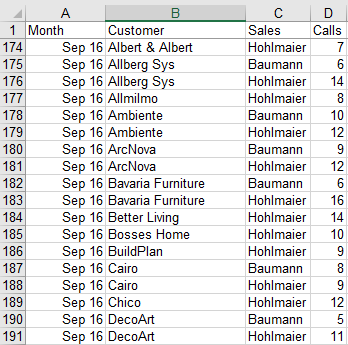
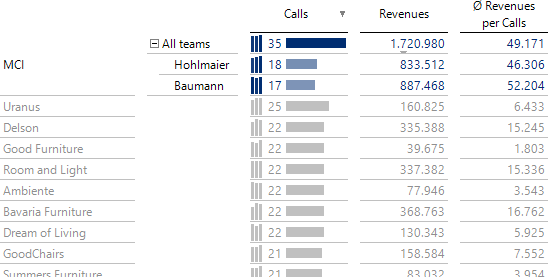
Information about phone calls does not exist in sales reports and analyses used for accounting. The IT department, however, kindly exported the data for a short period from the CRM system and delivered it as an Excel list so that we can compare it to the sales controlling. In the screenshot above, you can see how this list is displayed in DeltaMaster – and how it looked in Excel. The revenues shown here come from the known OLAP application. We supplemented the number of calls from the Excel file.
This example reflects the first use case from the introduction – a special analysis from another system. In this scenario, as well as the other two that we described (i.e. budget values, external sources), we could have also integrated the data on the database level. After all, connecting data from various sources is one of the main benefits of a data warehouse, and users can enter plan, budget, or simulation values directly in DeltaMaster and save them to a data warehouse. Maintaining the necessary structures in the database, however, requires special skills. It also involves a certain amount of effort, which you may not always want to take upon yourself – especially when there is only a small amount of data that you want to combine or it changes irregularly or rarely at all.
Creating and defining a Measure for external values
With DeltaMaster 6, you can define separate Measures (KPIs) that pull their values from an Excel file instead of from a database query. In order for this to work, the application must be based on MDX (e.g. Microsoft Analysis Services or SAP BW). You can also display and use these types of Measures in DeltaMaster 5. However, DeltaMaster 6 is required to create, edit, and update them.
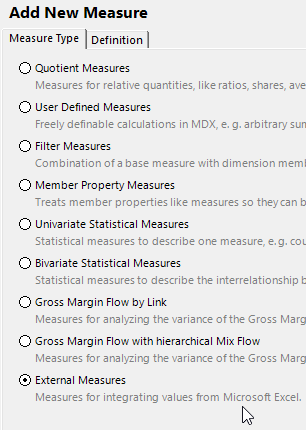
To create a new Measure, switch to Edit Mode. When Modelling, click on the three dots in the Measure Bar to open the Measure Browser. There, open the I want to menu to add a new measure.
For the Measure Type, select External Measures.
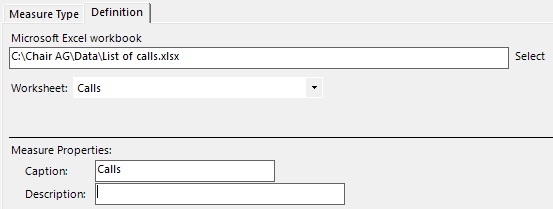
To define the Measure, you only need two entries: which file you want to use (Microsoft Excel workbook) and which Worksheet in it. DeltaMaster supports all popular file formats, including the old XLS format (prior to Excel 2007) as well as the newer XLSX, XLSM, and XLSB formats. We will explain below how to set up the table as far as content is concerned. As soon as you select a file, DeltaMaster will import it and offer your worksheets, including the hidden ones, in the selection list. The measure is based on exactly one worksheet that you choose from the list. That’s all! Just enter a name for the Measure and, if you wish, a description, and the new Measure is available in the current application.
In the Measure Browser, the Measure Type is marked as “ExternalData”.
Transferring by copying, without locking
When you create a Measure (or update a Measure as described below), DeltaMaster imports the selected Excel worksheet and copies the values to the application or analysis session. As a result, you can still work with the values even if the Excel file is no longer available in the future. This is possible due to the way that DeltaMaster captures the data: It reads out all data from the file in one go and copies it to the application (instead of opening a connection to the file and running queries).
This prevents issues with locked files as well! Even if you or another user have the file open in Excel or another program, you can still define, update, or use the Measure in DeltaMaster.
Presenting and using external values
This new Measure works just like any other Measure. It can be displayed in Graphical Tables, alone or in combination with other Measures, including those that originate from the same or a different Excel file. It can be used in calculations such as User-defined Measures or Filter Measures. You can Browse, Zoom, and Navi¬gate the Measure. You can use Measures from external data in all other types of reports as well: Geo Analysis, Portfolio Analysis, Time Series Analysis, and the methods of the analytic library. As with other User-defined Measures, data entry is not supported.
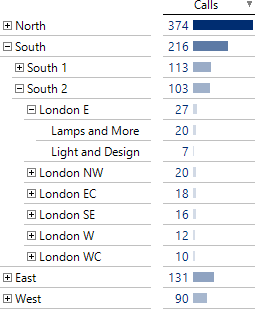
Let’s look at the example on the right. The number of calls from the Excel file is listed next to the revenues from Analysis Services. The calculation for Revenues per Call was defined as a Quotient Measure in DeltaMaster. Sparklines shed light on how the number of calls has developed over time. Using the Naviga¬tion, we have identified which sales teams made the calls and generated the revenues for the first customer.
Displaying and calculating with external values requires more computing time than database queries. This is the reason why the method is not suitable for large data volumes. A few thousand rows, however, are usually no problem.
Updating values: Shift+F9 or Measure Properties
What is really neat is that the Measure can access a fresh supply of data – in other words, you can update the values that were transferred to the application! In this case, DeltaMaster will reopen the designated Excel file and import the values again. You can update the Measure in two ways:
- In Presentation Mode or when Editing, you can start an update by pressing Shift+F9. The Shift key, to an extent, strengthens the function of the F9 key: F9 alone will recalculate the report with the current values from the database. In combination with the Shift key, it updates the values of the Measures from Excel contained in the report. This update in one report also affects all other reports that use this Measure.
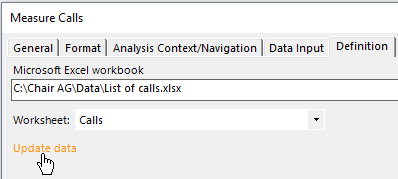
- In Edit Mode when Modeling, you can refresh the values in the Measure Properties, independently of the reports. The Definition tab contains a link to update the data.
The ease of use described above also applies to updating. You do not need to close the Excel file in advance. You can edit your values in Excel and update them in DeltaMaster at virtually the same time.
When working with applications in the Repository, you can only use Shift+F9 to update in the Windows client of DeltaMaster 6. This shortcut is not supported in the Web Client, in the App, or in the Office Add-in. In these cases, the application must first be updated in the Repository to make the new Excel data available in the application. If this task needs to be performed on a more frequent basis, you may want to create a job in Publisher (ReportServer) to update the Repository.
In DeltaMaster 5, you can use Measures with external values but you cannot update them in DeltaMaster 5. Applications in the Repository or analysis sessions (DAS files), therefore, must be updated with DeltaMaster 6 before they reflect the current values in DeltaMaster 5.
Setting up the Excel table
The Excel table must have a certain setup so that DeltaMaster can process it. The setup is a very common one, as you will see in the following example. The screenshot on your right shows an excerpt of the data. Each row lists the respective month, customer, sales team (Sales), and the number of phone calls that the respective team made with that customer in that particular month.
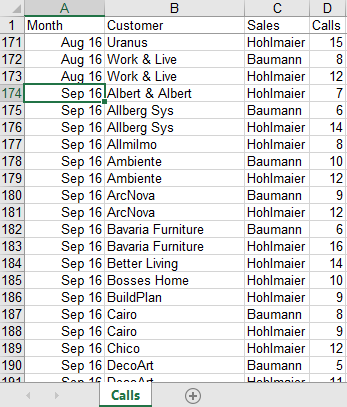
The setup of this table can be described using the following properties.
(1) List format
The table must be set up as a list. That means that each row contains a single data record. Cross tables are not supported.
(2) Column headings
The first row contains the column headings. These names must correspond to those of the dimension levels in the analysis model. The names displayed in the Dimension Browser – or, wherever appropriate, the current Alias Set – are what is important (not internal IDs or MDX names with brackets, etc.).
(3) Left side: One or more columns with Members
The first columns contain Dimension Members. These Members must belong to the level that is listed in the column heading and correspond to the current Alias Set (provided that one is active).
(4) Unique Member combinations
The combination of all Members in a row describes which cell in the OLAP cube should be assigned the numerical value. The Member combination, therefore, is a compound key that must be unique and complete. It is not allowed to have multiple rows with identical Member combinations, and all fields in each row must be populated.
(5) Right side: A column with the numbers
The numerical values are located in the last populated column on the right. The column heading is irrelevant because the name of the Measure will be defined in DeltaMaster.
Fulfilling these criteria does not involve much work because most exchange files are generated in this format anyway. One thing you’ll need to watch is covered in item (4) above: If multiple operations refer to the same Members, they will need to be aggregated in the Excel file. This is why our example shows exactly one row for each customer and month, with the total number of calls listed in the right-most column – and not, for example, one row per call with a count value of 1.
DeltaMaster will also transfer data records that cannot be allocated in the data model. If these records are not needed, they should be deleted beforehand.
How the application and analysis model interact
When DeltaMaster reads the records, it assigns the values to exactly one Member in each dimension referenced; the Members belong to the same level. The Measure returns no values below this level. Above it, the values will be automatically aggregated to a sum.
The levels in the analysis model must have unique names so that DeltaMaster can assign the column headings to the desired levels. This is not always the case. In some parent-child dimensions, for example, the levels are only numbered, and names such as “Level 02” can appear in customer as well as article dimensions. In these cases, you can rename the levels in DeltaMaster (when Modeling, click on the respective dimension in the Filter Bar, switch to the Levels tab, and rename the level in the context menu of the level). Aside from stabilizing the integration of external values, this improves the application as a whole because the level names are displayed in different parts of reports and on the user interface. Taking the time to create logical, unique names is definitely worth the effort.
When you assign values to level and member names, DeltaMaster will apply the respective current Alias Set as mentioned above. This makes it easy for users to prepare external data (i.e. how it looks in DeltaMaster is how it must look in Excel).
External values vs. DeltaMaster Modeler and self-service BI
As tempting as it may sound, the approach described above is no substitute for automated ETL processes or custom applications with an Excel file as a data source. The main reason is that you cannot build structures with the external values. You can easily “attach” them to existing structures, on a certain level in every referenced dimension. Upward aggregation starting on this level is also possible – but the hierarchy must already be in place. Aside from that, the Excel data is always integrated as a Measure; you cannot add any additional Members to a dimension. Also in cases where you need to integrate large data volumes, you should turn to other solutions. Fortunately, you can count on DeltaMaster for this as well. With the Modeler and the self-service functions, you have the professional tools to build both small and large applications from scratch.
