Greetings, fellow data analysts!
Humans have always had a fascination for machines. The ancient Greeks, for example, already had automatic door openers and analog computers. Apparently, they even constructed mechanical puppets to entertain a crowd. In 1738, the French inventor Jacques de Vaucanson presented a life-sized mechanical flute player – whose repertoire consisted of an impressive 12 songs. The professors at the French Academy of Sciences stared in amazement. Eighty years later, E. T. A. Hoffmann wrote in his story “The Sandman” of a student who unknowingly falls in love with a charming female robot.
We interpret motion as a sign of life – which could explain our fascination for machines. And culture has constantly reinterpreted the machine. Throughout DeltaMaster’s development, we sometimes let the machine take on more – and sometimes less – responsibility. We think that although it makes sense to automate whatever saves time and simplifies routine tasks, the challenge remains to try ‘exorcise’ the devil in the details. This edition of clicks! will focus on one task that we can definitely pass on to a machine. See for yourself!
Best regards,
Your Bissantz & Company Team
A good report name helps readers understand what they should expect to find before they even read it. Paying close attention to naming conventions, however, isn’t just a service to your report consumers. It also makes your work easier when you can quickly and clearly identify and differentiate the content of a certain report. The name of a report should give a clue as to its content. The content of a report, in turn, depends on the view – in other words, the time frame, country, type of contract, customer group, product division, organizational unit, type of currency, etc. Once you build a good report, it often remains stable over a period of time. The view, however, constantly changes.
To simplify the naming of titles in DeltaMaster, you can use variables which stand for a certain member in the report view. The Briefing book will then display the current setting in place of the variable. This way, you can highly automate the naming process of your reports. Once the view changes (e.g. at the turn of a month), the report title automatically changes accordingly. This same mechanism also works for the names of measures and calculated members; we will explain those in detail, however, in a future edition of clicks!.
Variables in report titles – time dimension
In the Briefing book on your right, the report “Margin Calculation” is open. As the user can see in the view description in the Report window, this report contains the values for July 2009. This, however, is not mentioned in the report name in the Briefing book. But if you renamed the report and added the name of the month, you would have to update this report every few weeks. By using variables, you save valuable time – and eliminate the risk of forgetting.
To rename the folder, simply press the F2 key or select the respective option in the context menu. You can now directly change the name in the Briefing book. The variable for the current period is called ‘{cp}’.
![]()
If you now hit the Enter key, you will rename the report and DeltaMaster will replace the variable for the period the report was saved with.
![]()
If you hit F2 again or reopen the edit mode in the context menu, you can see the variable again.
![]()
As soon as you save a different view in your report (e.g. ‘August’ as shown in the screenshot on the right), this setting will automatically appear in the report name. This also applies when ReportServer or the Briefing book generator updates the view.
Displaying the time period in the report title is just one common example. In addition to ‘{cp}’, you can also choose from a wide range of other variables which lead to other time periods based on the current time member (i.e. the one saved in the report). These occur in combination with Time analysis members, which have been described in detail in DeltaMaster clicks! 08/2007. This edition also contains a table with sample time variables.
Variables in report titles – various dimensions
We have implemented the variable ‘{cp}’ shown in the example above and other commonly used time variables as abbreviations in DeltaMaster. Instead of the abbreviation ‘{cp}’, you could have also written ‘{[Periods].CurrentMember}’. DeltaMaster will replace these expressions with the current member in the listed dimension.
DeltaMaster interprets the expression written in curly brackets as an MDX statement because it returns a member or a member property. As a result, it can also access a member alias such as ‘{[Periods].CurrentMember.Properties(“LongName”)}’.
Within the curly brackets, you can use more than just time dimensions. As a result, you could add the names of the customer regions to the report title as shown in the screenshot on your right. This option is very useful when you want to create an analysis using different perspectives, for example, so that you have them on hand in a pre-calculated form or can export them individually.
Duplicating reports with dynamic names
Let’s say that you have saved an ascending and descending Ranking of your products sorted by how sales have changed in comparison to the previous period. Now you want to create separate top-bottom rankings for each of your four sales regions (i.e. Eastern, Central, Mountain, and Pacific). To ensure that you can differentiate these four reports, you should note the name of the respective region in each report title. If you have created a report title that automatically changes with the view, such as ‘{[Customers].CurrentMember}’ as shown above, you don’t need to make any further changes.
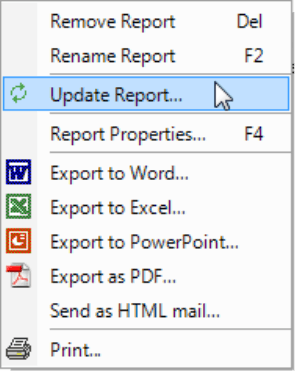
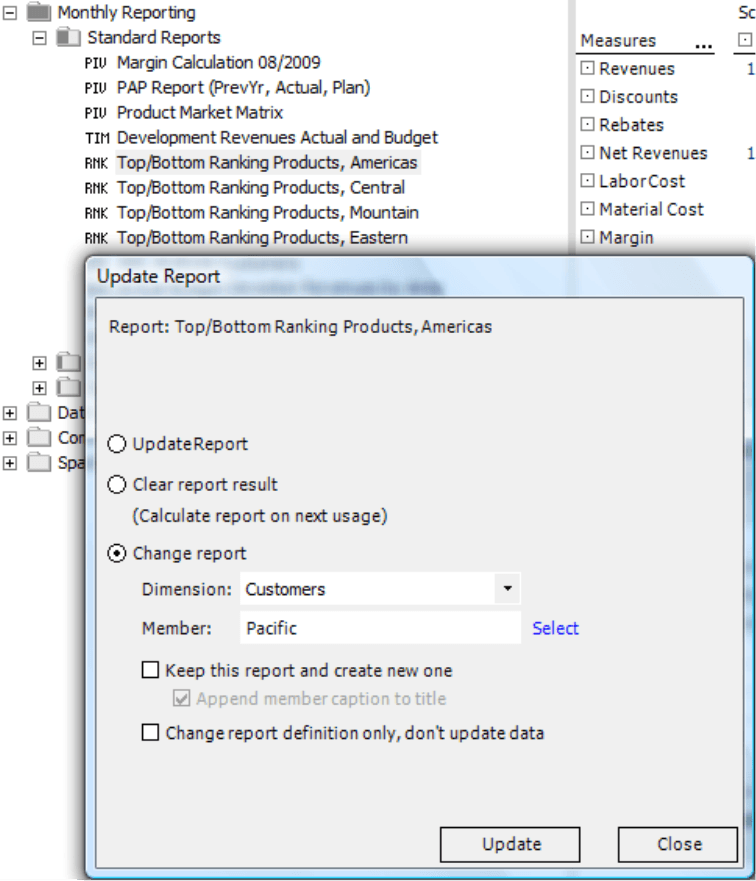
If you want to copy a report and change the view, simply use the Update report option located in the context menu of the report.
In the dialog box, you can select if you want to Keep the report and create a new one. Here, you can use your first top-bottom ranking as the basis for subsequent reports. In the new reports, you can successively change the selected member to Eastern, Central, Mountain, and Pacific. After you have updated the report, the dialog box will remain open so that you can create all of your copies with just a few mouse clicks. In this case, do not select the Append member caption to title option. This adds the changed member name as static text to the existing report title. Since the title already contains the customer member as a variable, this option would simply list the name a second time.
Now you have four new reports that all show which view they contain.
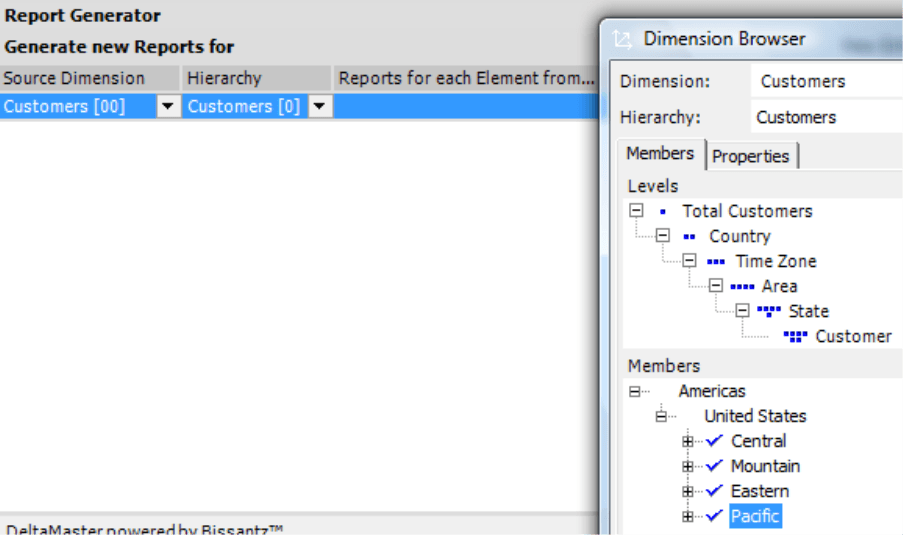
Instead of duplicating the reports manually, you can also delegate this task to ReportServer. Instead of just creating individual reports, this option allows you to use selected folders or even the entire Briefing book. This iteration, which successively changes the view to certain members, is a job for the Report generator. It loops through all selected members, changes the view internally, and generates separate output documents during each turn. Report generator, too, supports variables during these automatically generated view changes. Here, you can clearly see the advantage of giving report titles dynamic names.
Even easier…
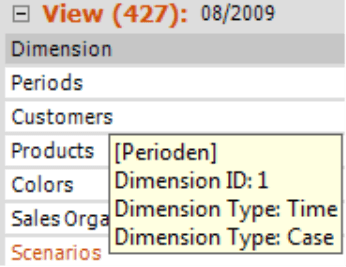
Most times when you want to add a dimension member to a report title, you are referring to the current member (‘.CurrentMember’). That’s why DeltaMaster also supports an abbreviated form. ‘<viewX>’ will be replaced with the current member in dimension ‘X’, whereby ‘X’ stands for the internal dimension ID. You can view this ID if you hold the Alt key while mousing over the dimension name in the View window. Curly brackets are not necessary.
The screenshot above shows that the time dimension in this case has the ID ‘1’. To enter the current member into the report title, therefore, we could either write ‘<view1>’ or as described previously ’{[Periods].CurrentMember}’ or ‘{cp}’. In general, we recommend that you use time variables for the time dimensions. This way, you only have to glance at the title to see if you are dealing with a time dimension or some other type. In particular, you can also access other time members which otherwise require tricky MDX expressions such as ‘{pyaY,X}’ to show the same period in the previous year, on level Y, with a gap of X (for more information, please read DeltaMaster clicks! 8/2007). If it is referring to the current member of another dimension, we prefer ‘<viewX>’ in place of the complete MDX expression. The advantage of the latter option is that you can reach members other than the current one and return member properties as well.
By the way, DeltaMaster does not support variables in Action titles (see DeltaMaster clicks! 10/2009) or report comments for a reason. These fields are designed for personal words, messages, warnings, explanations or background information. Automatic updates, therefore, would not be suitable.
Report title, view and axis definition
As you already know, you can either select members from the view or in the Axis definition of pivot tables. For more information on the differences, please refer to DeltaMaster clicks! 5/2009. The variables always refer to the content that is selected in the view; they cannot, however, access properties in the Axis definition.
Variables in folder titles
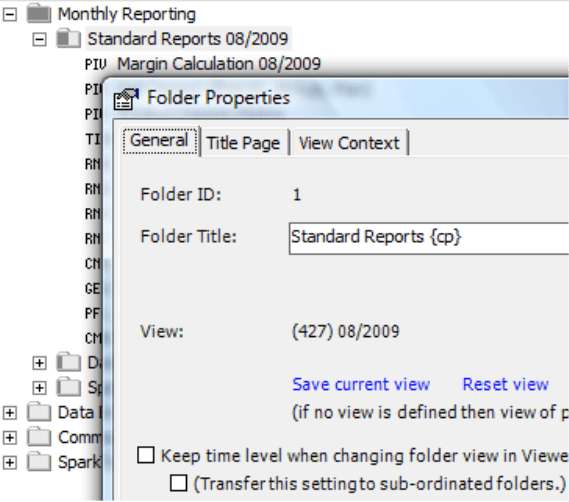
All variables that we have described on the past few pages also apply in the names of folders. Please note, however, that folders are not an analytic view of their own but rather an instrument for putting things in order. This is why folders do not have a view in the default setting. And if they don’t have a view, DeltaMaster cannot replace a view variable in the folder names. In this case, DeltaMaster does not show an error message. It simply leaves the entry blank so that no strange variable expression blemishes your Briefing book.
To save the current view to a folder, you can either select the respective option in the Folder properties (context menu) or save the view from the View window into the report folder (Start view menu).
Questions? Comments?
Just contact your Bissantz team for more information.


