Dear data analysts,
Preparing data in such a way that it can be analyzed fluidly can be an extremely laborious job. Techies use software that is known as ETL tools to do this. “ETL” stands for extraction, transformation and loading. The tools usually are just as complicated to use as their names are complex. So what do you do when you want to analyze data and there is no techie in sight?
This is where ImportWizard comes in, our 80:20 tool – a supplement to DeltaMaster: It can do 80% of what the complicated tools can do, but causes just 20% of the trouble. And what does that mean for you? “Ready – steady – cube!”
Kind regards,
Your Bissantz & Company team
Typically, analysis and reporting applications access data that is regularly “pulled” from (operational) ERP systems and processed into OLAP cubes. We already described this architecture schematically in DeltaMaster clicks! 07/2006. The multi-dimensional structures of the cubes can be analyzed more flexibly and more quickly than the original tables. Most DeltaMaster analysis modules make use of this feature and work multi-dimensionally.
However, every once in a while, one has to work with data that is not in a cube. In order to be able to study this data with the typical analytical instruments from DeltaMaster, we have to put the data into a cube. Take the following examples:
- In mid-sized businesses, and even in subdivisions of larger companies, it is not guaranteed that you will find a spacious IT landscape with “full grown” OLAP databases and integrated processes for data transfers. Instead, many operational application systems are based on smaller databases such as Microsoft Access. But even this information needs to be analyzed, and therefore, cubes are needed.
- Marketing has done a large customer survey and saved the data in an Excel worksheet. Now, the features and responses are to be analyzed using all the tricks in the book.
- In order to prepare a new, integrated DeltaMaster application, you’ve received example data that you wish to analyze closely in order to be well prepared at the start of the project with a “rapid prototype”.
In these situations – and many others – ImportWizard is an ideal supplement to DeltaMaster. Its task is to create OLAP cubes that you can analyze using DeltaMaster out of input data that is structured in a table. ImportWizard‘s charm is that it is extremely simple to use. It was specially developed for the needs of end-users in non-technical departments and puts the users in the position to create analysis cubes spontaneously, without any knowledge of databases.
The ImportWizard can read data from the following sources:
- Microsoft Excel worksheets (.xls)
- Tables and queries from Microsoft Access (.mdb)
- Tables and queries from ODBC and OLE DB connections, for example Microsoft SQL Server
and save the data as cubes for Microsoft Analysis Services 2000 or MIS Alea 3.7 to 4.1. The option to create what is known as a local cube file is of particular interest: it can be used even without an OLAP server.
In the example on the next page, we want to transform the relational source data from our demo database “Chair” into a cube. The important thing here is the basic method of operation. Due to the limited space for presentation, we cannot go into detail about all program options, exceptions, modeling alternatives and so on.
From the start…
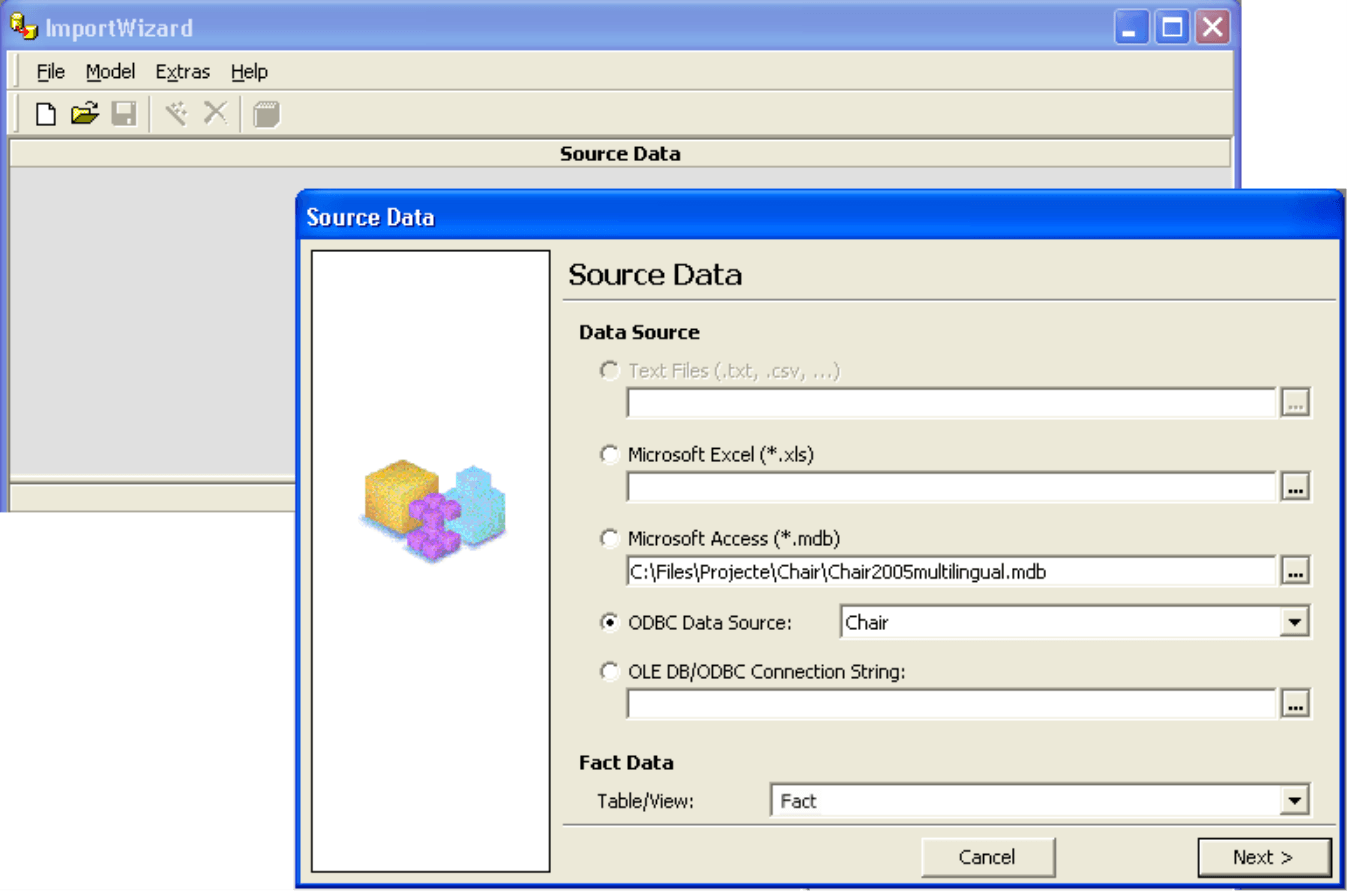
When you start a New Project from the File menu, a wizard appears with which you can select the Source data for your future cube. In our case, they are in an Access database. However, you can also select an Excel file or an ODBC or OLE DB data source. As soon as you have selected the file or ODBC data source, ImportWizard indicates which tables, views (queries) or worksheets are found at the source under Fact Data. The fact data is, loosely speaking, the key figures and criteria that you will later see as analysis values and dimensions in the analysis model. Please select the Table/View containing your data, and click on Next.
… to the finish line
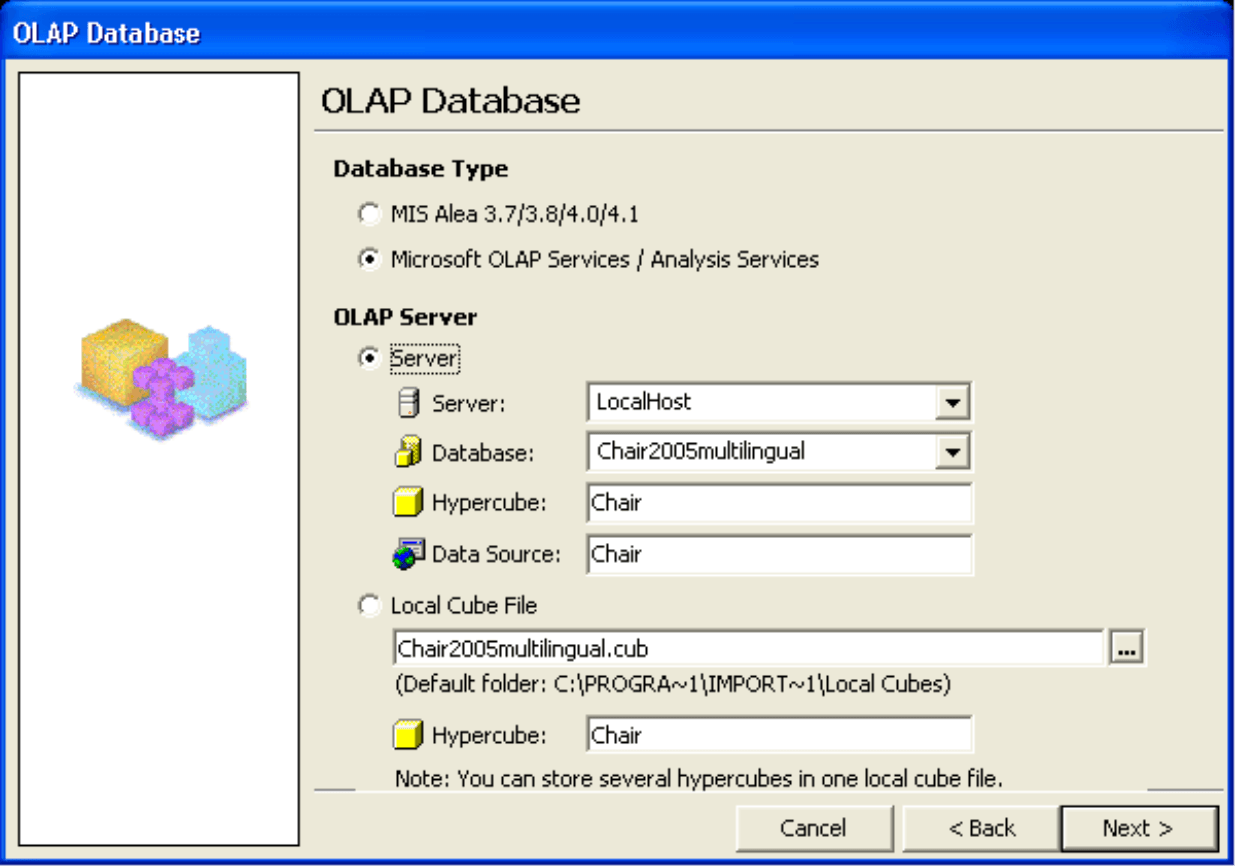
In the next step, define the target format for the cubes generated by ImportWizard: either for MIS Alea or for Microsoft Analysis Services. Under Analysis Services, select the name of the server that will receive the cube and enter a name for the database, the cube and the source. Alternatively, you can save the cube file locally to use it without a server installation.
Dimensions over dimensions
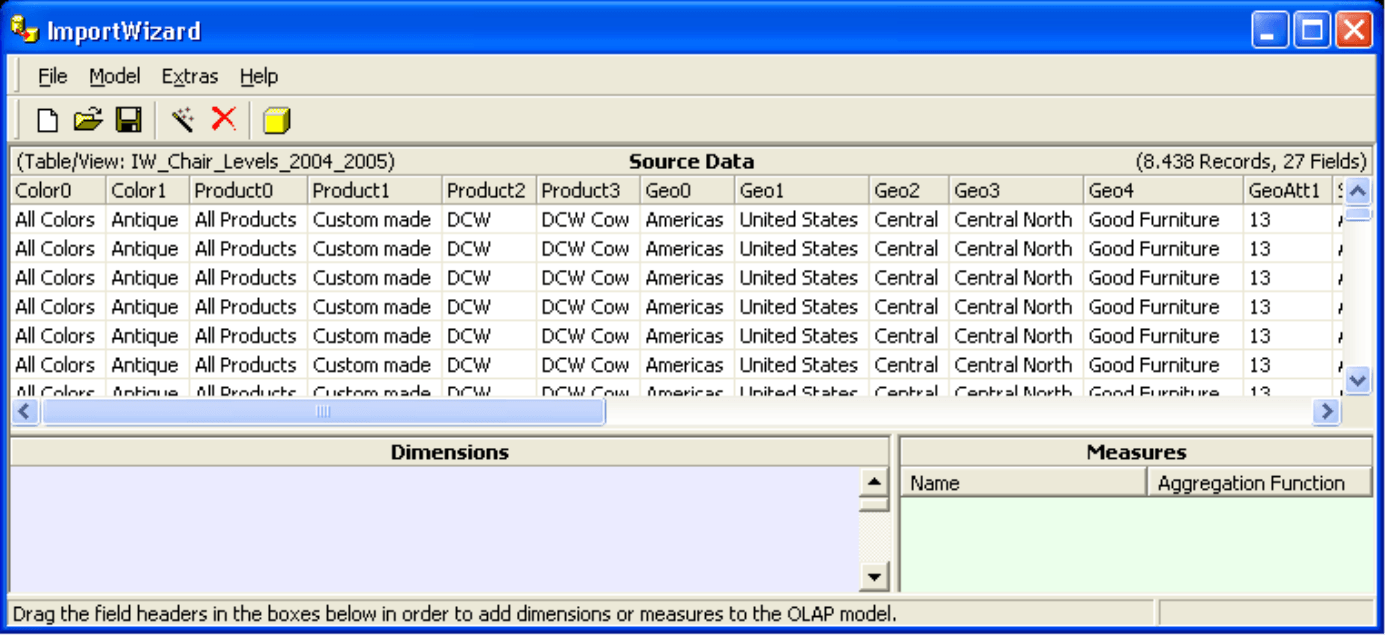
The screen appearing now is split into three sections. In the upper area, ImportWizard shows an excerpt of the data source. The redundancy displayed e.g. in the three fields for the products, is desired – it is the basis for dimensional hierarchies. The bottom window displays which dimensions and analysis values are to be depicted.
In order to create your model from the available fields (columns), simply drag the column header with the mouse and drop it in the dimension or value window, depending on if the field should be a dimension or a measure in your cube.
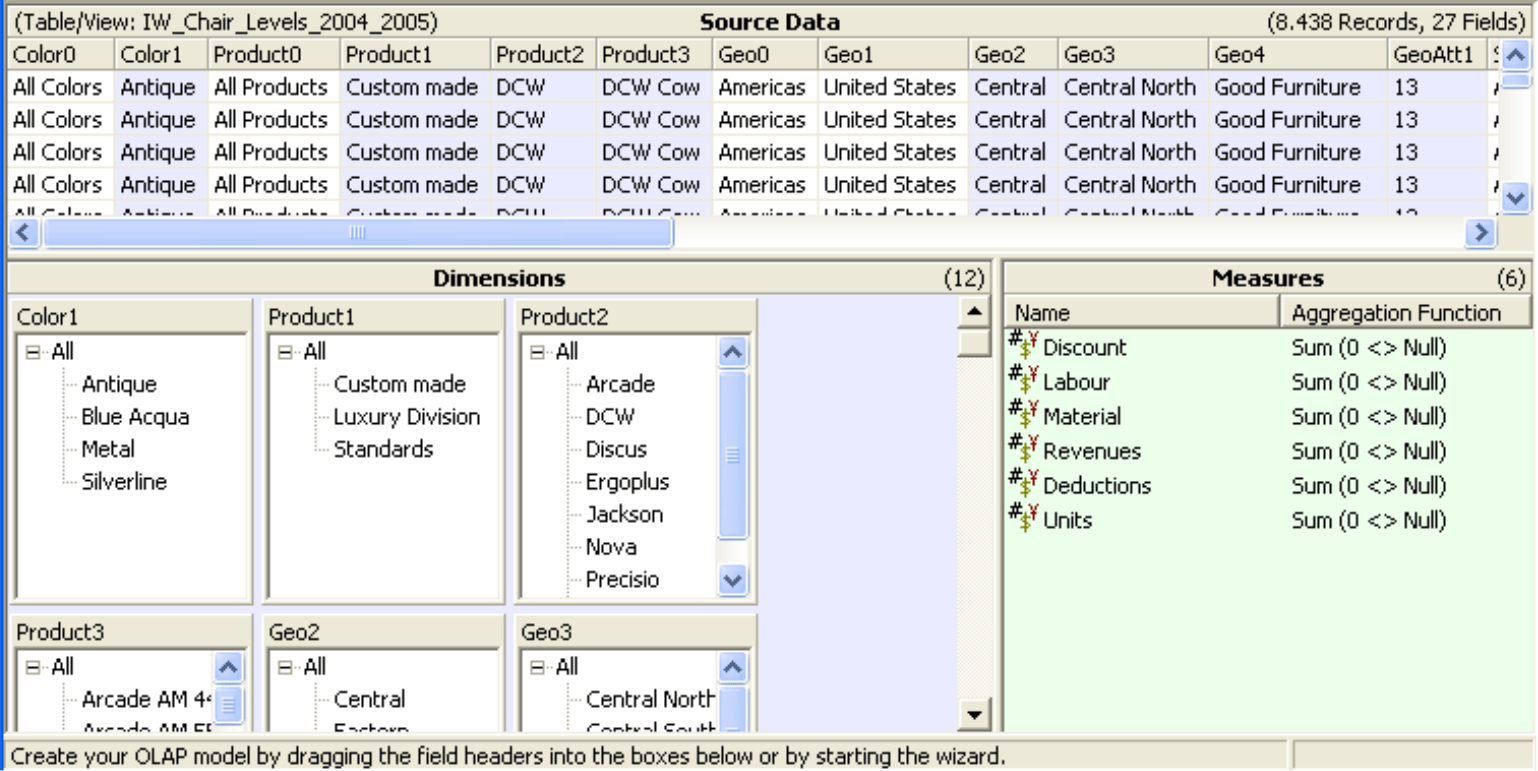
It’s even faster with the wizard: When you click on the button with the magic wand, ImportWizard recognizes dimensions and measures automatically. ImportWizard inspects the source data with a series of heuristic techniques in order to recommend the best possible result. The model that the wizard creates can be changed as needed. In our example, ImportWizard recognized all analysis values and most dimensions correctly.
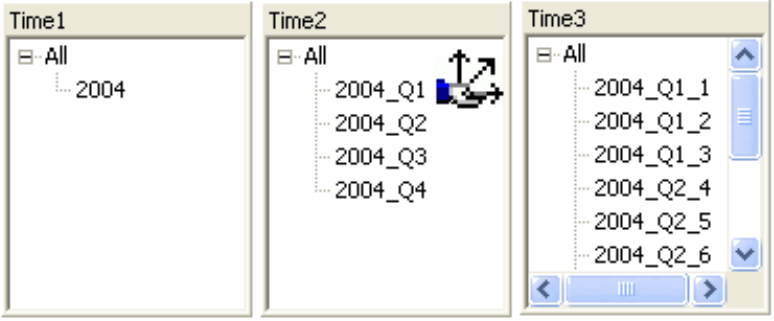
Columns that are already used as a dimension or measure are marked with a background color. The model is still missing hierarchies, for example the typical differentiation of years, quarters, and months, or the division of articles into main product groups, product groups and products.
And even this is done quickly with ImportWizard: Press the Ctrl key and drag the column heading of one dimension box into another. This is done automatically and requires no confirmation if ImportWizard finds a connection using the redundancy of the source data.
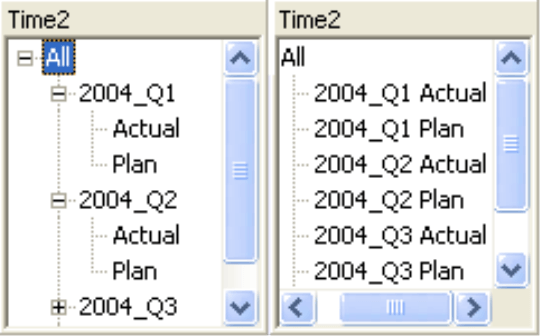
If the connection could not be derived, the system asks if the second dimension should be placed below or behind the last level of the first dimension. The difference can be seen in the figure on the right. For demonstration purposes, an inexpedient hierarchy was selected. The value types can be found below the years on the left side of the image and next to the years on the right side of the image
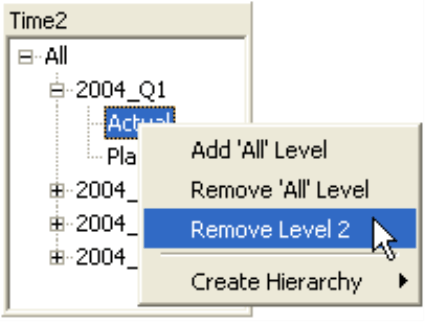
In the context menus of the dimensions and levels, you can find additional options, e.g. to rename or remove them from the model. If you would like to undo an unfortunate allocation like the one in the image above, click on an element of that level and remove it. ImportWizard can also automatically create hierarchies for common structures such as postal codes or dates. Here it is not necessary to include additional columns in the source data.
Measuring
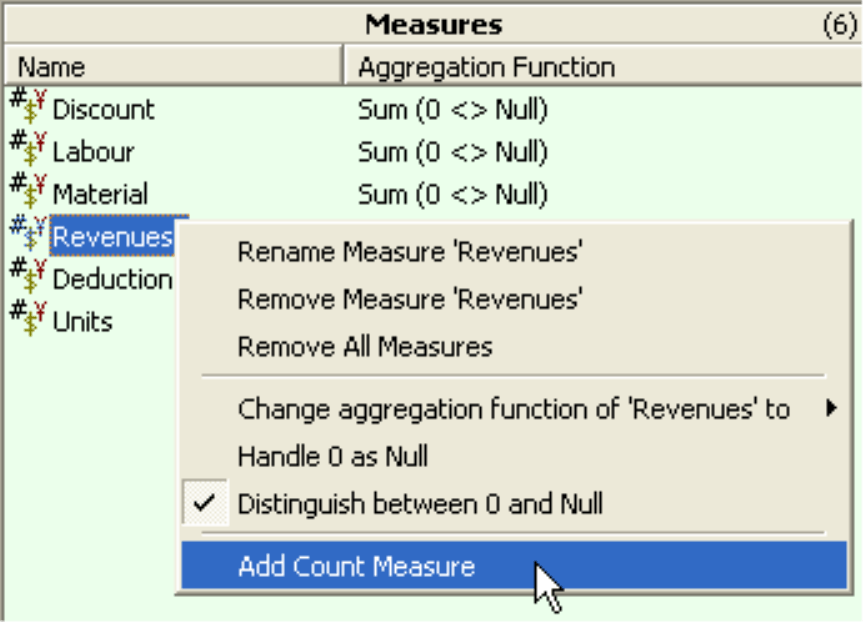
Your cube measures – those automatically created by the wizard as well as you own– can be renamed or further parameterized. Using the context menu, you can define the function you will use to aggregate the values. The most common aggregation is a sum. The other variants, e.g. the median, only come into play in a few cases.
It is also often useful to Add a Count Measure to your cube to have the number of records available e.g. to use them for ratios.
Cubed
When the model meets your needs, click on the cube icon in the toolbar in order to create the cube. If you decided on a local cube file and have not entered a path, ImportWizard creates the file in the “Local Cubes” subdirectory of the ImportWizard installation folder, typically “C:Program FilesImportWizardLocal Cubes”.
You have now successfully created your cube and can analyze it in DeltaMaster to your heart’s desire.
The modeling project itself can be saved by clicking on the diskette icon. This way, you can re-create the cube with up-to-date data or modify the cube structure without having to start from scratch again.
All customers and partners can download and evaluate ImportWizard from the member section of our website. The entire functionality is available without restrictions, but creating a cube requires a license.
