Greetings, fellow data analysts!
“No news is good news” is a typical motto of stressed-out managers. But why, actually? Are managers simply pessimistic when they say that if they receive a message that it can only be something unpleasant? Or do they just have a healthy portion of self-confidence when they say if they haven’t heard anything, nothing that bad could have happened? Maybe, perhaps, managers just wish that they could receive less information for a change instead of being inundated with loads of e-mails, reports and other information.
Although it can’t change the content of your information, DeltaMaster and its Report Server can at least help you quickly improve how you supply information. Through exception reporting you can determine when reports will be created and sent – or not – based on your current data. Talk about good news!
Best regards,
Your Bissantz & Company Team
Instead of just getting reports at regular intervals, many report consumers prefer to only to receive notification when a certain limit has been reached or exceeded. This concept is better known as exception reporting or alerting. DeltaMaster Report Server has been specially designed for creating and distributing reports at set time intervals. Back in DeltaMaster clicks! 08/2005 we introduced the functionality of Report Server in detail. This issue, however, will focus on how you can “teach” the system to monitor certain data constellations and only produce and send reports based on these Events.
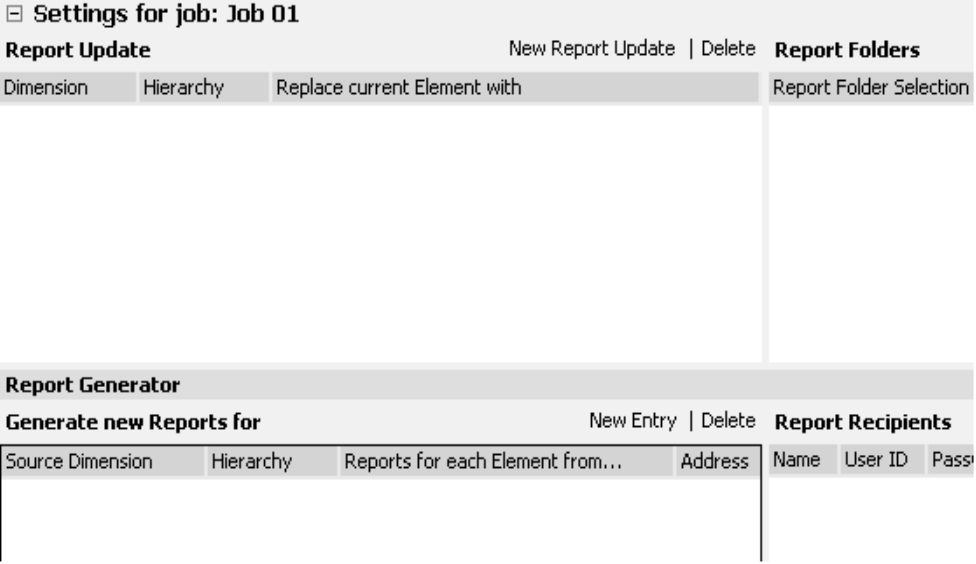
The key to exception reporting lies in the Report generator field on the lower left side of the Report Server. Here you can define so-called iterators that perform a task for several members of a dimension in a loop. DeltaMaster then calculates the reports in the selected briefing books for each of these members and distributes them (e.g. by e-mail or to the file server).
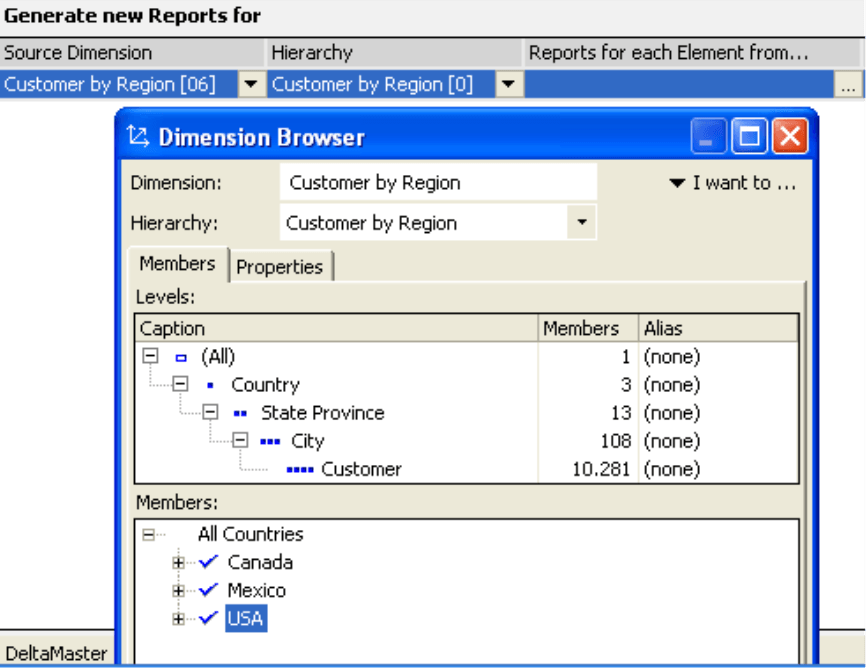
Using Microsoft’s “FoodMart” reference model, let’s assume that you need to prepare sales statistics for each country. In the Report generator window, you first specify that the iteration should run through the Source dimension “Customers by Region”. In the Reports for each element from… column you select the members “Canada”, “Mexico”, and “USA” from the Dimension browser. When you Run this job, DeltaMaster’s Report Server will generate the selected report for each region.
With just a bit of MDX, you can use this mechanism to create and send reports based on defined events.
Filtering report generator members
By selecting the three end-customer countries, we have generated an MDX expression in the Reports for each element from… field:
[Customer].[Customer by Region].[Country].&[Canada],
[Customer].[Customer by Region].[Country].&[Mexico],
[Customer].[Customer by Region].[Country].&[USA]
Alternatively you can directly enter the MDX expression “[Customer].[Customer by Region].[Country].Members“ (F2 key).
This code describes a set in which the report generator can process its members. The set does not have to be defined through an explicit – and static – selection by the user. In fact, you can also set this dynamically using a MDX expression. The filter function, which is particularly useful in this case, has the following syntax:
Filter(<Set expression>, <Numeric expression >)
The numeric expression, which is used as a criterion for comparisons, is checked for each member of the set expression. The function returns the members of the set meeting the condition. If the resulting set is empty, Report Server does not have any members to count and will not create a report. In other words, DeltaMaster will only create and distribute exception reports when the (exception) condition has been filled.
Note that there is a fine difference. If the Reports for each element from… field in the Report generator is empty, DeltaMaster will not run an iteration. If the field contains an MDX expression that returns an empty set, DeltaMaster will close the job without creating a report.
Let’s assume that you now want to create reports for the states or provinces whose May revenues exceeded $100,000. You would enter:
Filter ([Customer].[Customer by Region].[StateProvince].Members, ([Measures].[Store Sales], [Time].[2007].[Q2/2007].[May 2007], [Value types].[Actual], [Time Utility].[Actual]) > 100000)
The first parameter “[Customer].[Customer by Region].[State Province].Members“ selects the members of the customer dimension on the level of the federal state or province. This is similar to what we defined above in the dimension browser. The second parameter “([Measures].[Store Sales], …“ describes the rule that will be checked for each member. Sales should be larger than $100,000. You can also create more complex criteria using logical operators such as AND, OR, NOT and XOR. Furthermore, it is possible to automatically adjust time specifications using the SQL update command.
What is important, however, is that the member used for comparison is completely specified, because the report view is not available when the comparison is calculated internally. For all dimensions in which you do not want to consider the top members, therefore, you have to explicitly state which members you want to consider (e.g. time frame and value type).
Comparing with variances and other calculated members
Instead of setting absolute values as limits, it usually makes more sense to use calculated variances such as budget-actual variances or the percentage of change from the previous period. These are typically modeled as calculated members.
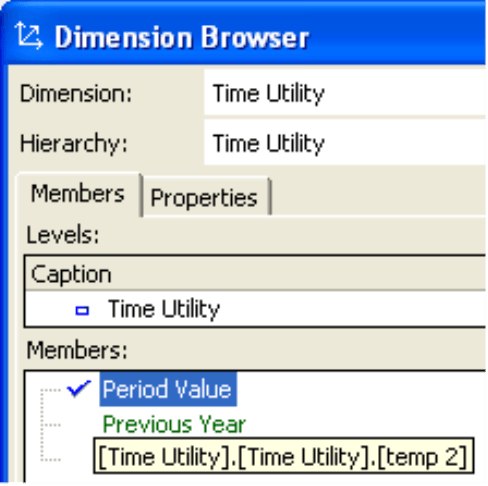
In order to use them in MDX, you will need their internal MDX names. DeltaMaster displays these names in the Dimension browser (hold the Alt key and mouse over the member name) as well as many other locations.
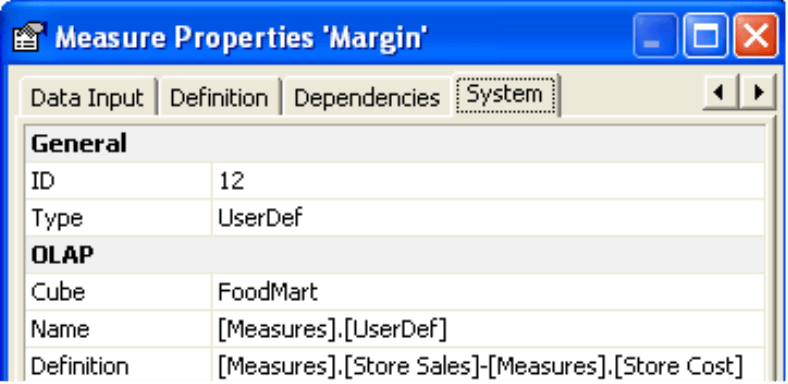
If you want to enter a calculated measure like a margin, you will also have to enter its MDX name, which you can access under Measure properties on the System tab in the Name row.
Therefore, if you want to only send sales statistics to a certain region when the previous period variance for the margin exceeds the allowed threshold (not absolute revenue as in the previous example), you will first need to identify the necessary MDX names. In our “FoodMart” example, the internal name for gross margin is „[Measures].[UserDef]“ and the previous period variance, which is a calculated member in the Time Utility dimension, is called “[Time Utility]. [Time Utility].[temp 2]”.
Based on this information, you would use the following filter expression:
Filter ([Customer].[Customers by Region].[State Province].Members, ([Measures].[UserDef], [Time].[2007].[Q2/2007].[May 2007], [Value types].[Actual],[Time Utility].[temp 2]) < -0.05)
This expression will only generate reports for the states and provinces where the actual margin is more than 5% below April 2007.
Warning: Use with caution!
The ultimate purpose of exception reporting is to suppress information overflow. Instead of a constant flow of information, report consumers should only receive notification in special situations that were defined in advance. The concept of threshold reporting, however. is also controversial. Why is a 5% variance relevant if a 4.98% variance is not? Which limit should you set at which level of detail?
The business information systems expert Norbert Szyperski already warned about these problems back in 1978. “Specified thresholds in combination with the fictional management by exception are dangerous. Managers should be inquiring minds who seek out new relationships in their information – not a watchman who dozes at the switchboard.[1]”
In closing, use the data-driven report delivery functions with caution. After all, DeltaMaster already offers you the tools you need to design attractive and informative standard reports. Your readers should look forward to receiving them (instead of not!).
[1] (quoted by Mertens/Griese in Integrated Information Processing 2 (Integrierte Informationsverarbeitung 2), Wiesbaden 2002).


