Greetings, fellow data analysts!
In Bavaria, where DeltaMaster is developed, we say ‘Servus!’ as a friendly way to greet or say goodbye to someone. What many people today don’t realize, however, is that this term stems from the Latin word ‘servire’ or the willingness to serve.DeltaMaster, too, is ready at your service. One example is the teamwork between its Viewer and Miner modes. Viewer is the user mode that serves decision-makers best. Those who deliver them the information to make those decisions, however, get the functionality they need in Miner. These users serve managers, executives, and supervisory board members with the information they need.When you serve good reports, you should empower your readers to make their own conclusions. As we have often pointed out, however, gadgets such as traffic lights and gauges take away that ability to make decisions. We hope that the tips in this edition of clicks! are of a service to you in managing this tricky task.
Servus from Nuremberg!
Your Bissantz & Company team
The way that users handle data and which tools they need to do that often depends on their individual roles and responsibilities within the company. DeltaMaster accommodates these varying needs with its multilevel user concept.
In five consecutive levels from Reader to Miner, DeltaMaster activates more and more functionality to give every single user the exact level of support that he or she needs – and can handle. In addition, this user model also allows you to define processes through a division of labor: managers, executives, supervisory board members, and other ‘users’, therefore, can access interactive reports that were created by analysts, planning specialists, or other ‘report editors’.
Most people who read clicks! work in higher users levels and, therefore, know how to create reports for their individual audiences. Their readers, in turn, generally access them in Reader or Viewer mode. One advantage of the Viewer mode is that it provides report consumers the flexibility to adjust the report content spontaneously and without needing to deal with the complexity of large and complex OLAP models. DeltaMaster has a wide range of parameters that are designed to make your applications (i.e. briefing books) as comfortable and appropriate for your consumers as possible.
In this edition of DeltaMaster clicks!, we’d like to share a few tips on how you can make Viewer applications especially user-friendly. We’re certain that your report readers will thank you for your trust and consideration.
Between Reader and Pivotizer
In Viewer, the structure and layout of a report (e.g. the displayed measures, levels and members) is predefined and users can either not change it in any way. That’s how Viewer and Reader are similar. The main difference, however, is that Viewer users can also access the View window to get an overview of the data model. Unlike Reader users, therefore, Viewer users can modify the filters or limitations that apply for that report. Functions such as editing the Briefing book and creating new reports, however, are only possible in Pivotizer and higher.
Good: Selecting dimensions for Viewer
Do your report consumers really need all of the dimensions in your analysis model? Experience has shown that users often only need to see a portion from which they can make their own selection. Long lists of dimensions – some of which are for special purposes or even just draft versions – often confuse readers more than they help them. Using the View context, you can define limitations for Viewer users to make working with DeltaMaster as simple as possible.
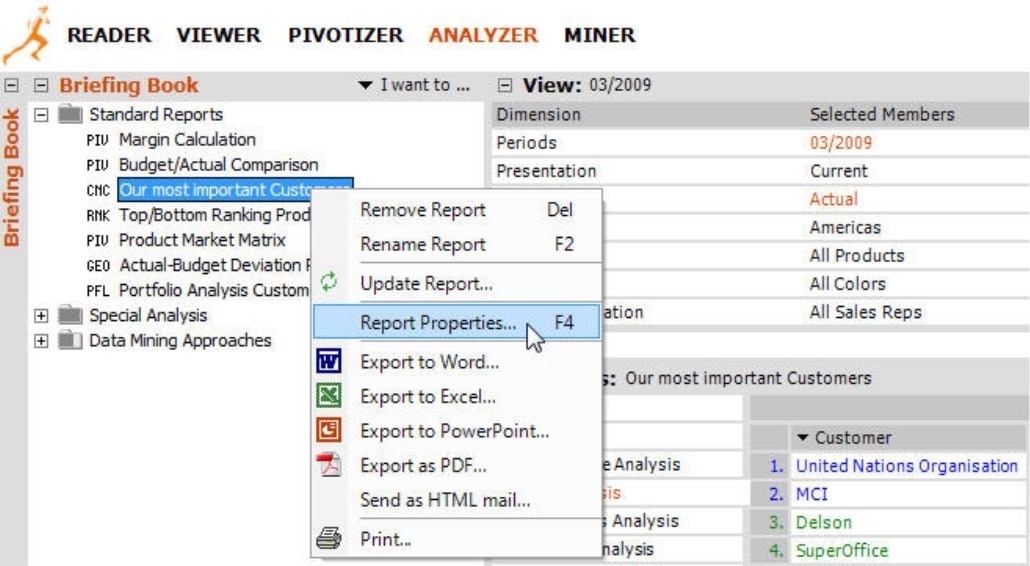
Let’s assume that you have used our ‘Chair’ reference model to create a concentration analysis and now you only want Viewer users to be able to modify the time dimension. To hide the other dimensions for Viewer users, you can edit this setting under Report properties, which is located in the context menu of the respective report. This function is available to users in Pivotizer, Analyzer and Miner levels.
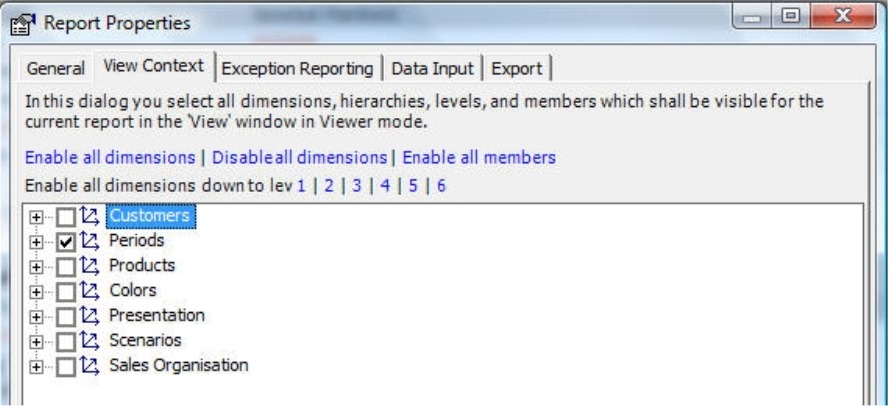
On the View context tab, you determine which dimensions should be shown in Viewer mode. For this example, you only want to use time (i.e. ‘Periods’).
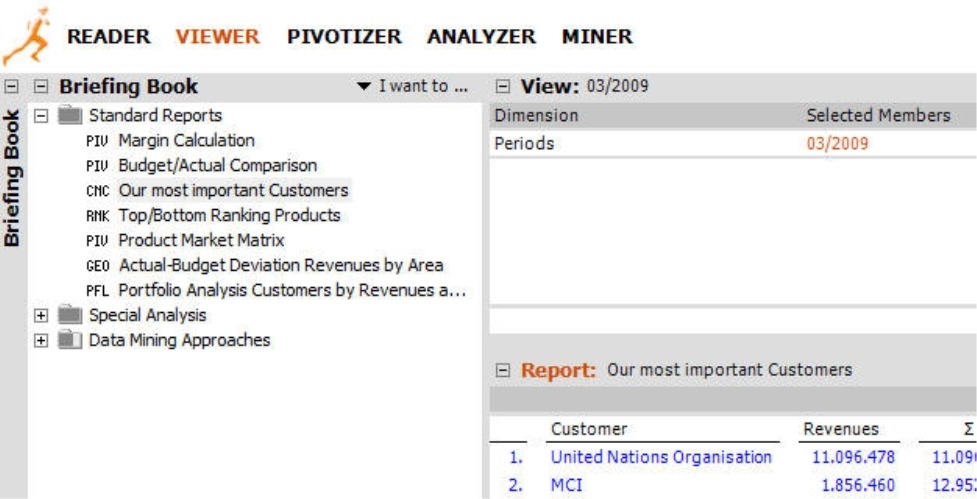
If you now switch into Viewer mode, you can immediately see the results. The dimensions which were deactivated in the View context are no longer displayed in the View window, the Dimension list or in the Hyperbrowser (provided that this is licensed for Viewer mode). Viewer users themselves cannot cancel this limitation because they cannot edit the View context or any Report properties for that matter.
Now, the view is cleaner, there is more space on the screen and the users aren’t bothered by selections that shouldn’t concern them in the first place. If we had deactivated the time dimension as well, the report would appear exactly as it does in Reader mode without any possibility to change the view.
Better: Selecting levels for Viewer
Using the View context, you can define the selection criteria such as the number of dimensions that should be displayed in the View of Viewer mode.
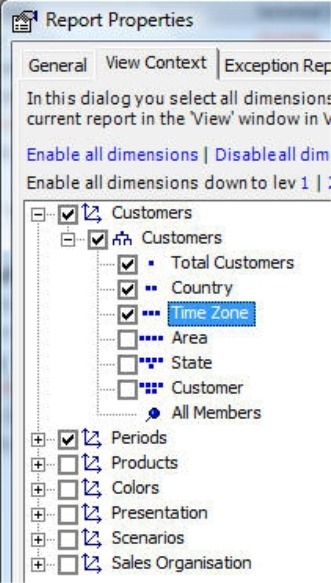
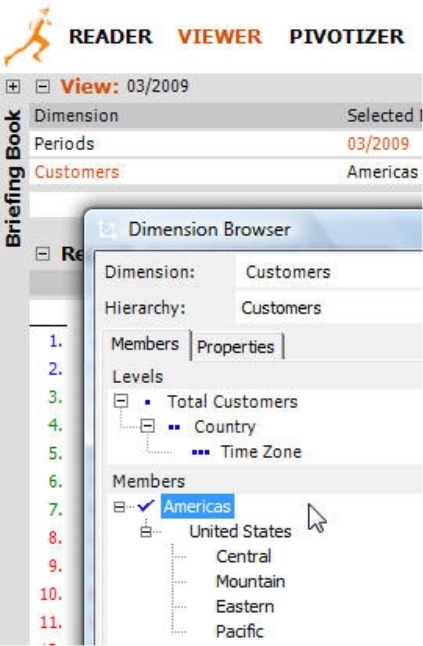
Let’s say that the consumers of the concentration analysis described in the previous section now want to be able to modify both the time and customer dimensions. They would be satisfied, however, if they could simply switch among the time zones. (Besides, it doesn’t make sense to run an concentration analysis on a detailed level because the number of customers in these regions is relatively manageable.) The screenshot on your right shows how to make this selection in the View context.
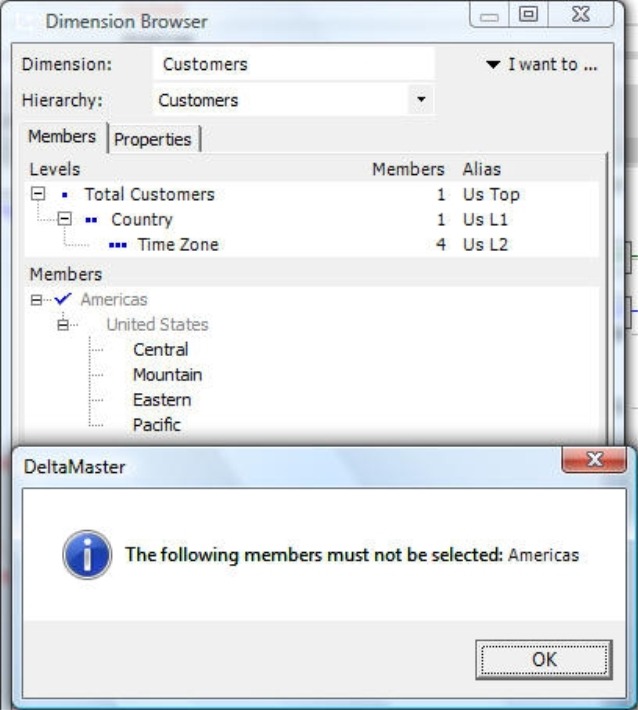
As a result, Viewer users can now select the ‘Customer’ dimension. In the Dimension browser, however, they can only select the members on the ‘Region’ level. The subordinate levels (i.e. ‘Area’, ‘State’, and ‘Customer’) remain hidden.
If you hadn’t marked the ‘Country’ and ‘Total Customers’ levels in the View context, Viewer users would be able to see but not select them in the Dimension browser. As a result, you could save a report with a view that Viewer users can open but cannot modify. That could be intentional. If not, you should select the desired levels and all of their respective parents including the top level.
Best: Selecting members for Viewer
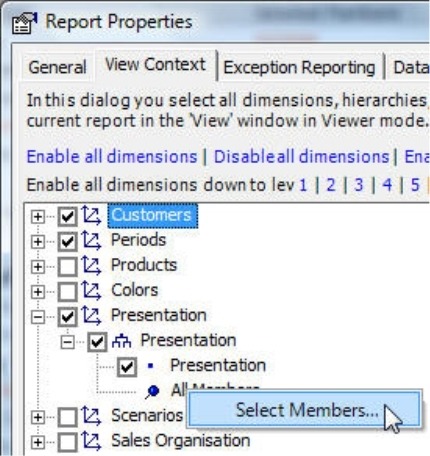
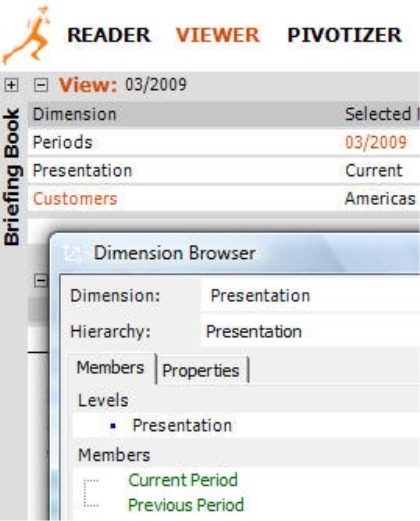
If you use DeltaMaster 5.3.6 or higher, you can even show or hide individual members using the View context. This option is preferable in flat hierarchies that have no ‘top’ member such as value type (‘Plan’, ‘Actual’) or presentation (‘Time utility’, ‘Current’, ‘Previous period’). In this case, you can’t just show or hide hierarchy levels because either all or none of the members would be displayed in Viewer. To select specific elements, go to the entry marked by a thumbtack (‘All members’) and open the context menu.
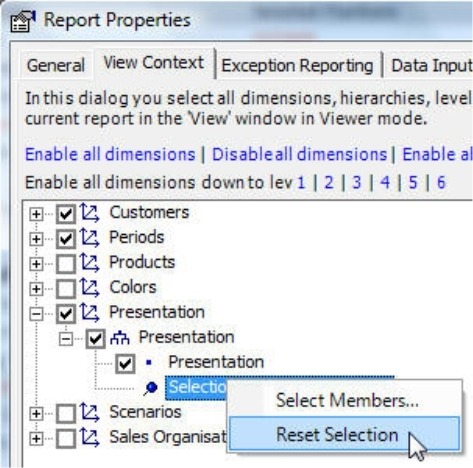
Once you have selected the members in the Dimension browser, DeltaMaster will display these members in place of the ‘All members’ label in the View context. The context menu now contains the option to Reset [the] selection so that you can again display all hierarchy members in Viewer mode.
If you now switch into Viewer mode, you can instantly see the difference. Instead of all members from the presentation dimension, DeltaMaster will now only display the two selected members in the Dimension browser as shown in the screenshot on your right.
Using folders to define the View context for multiple reports
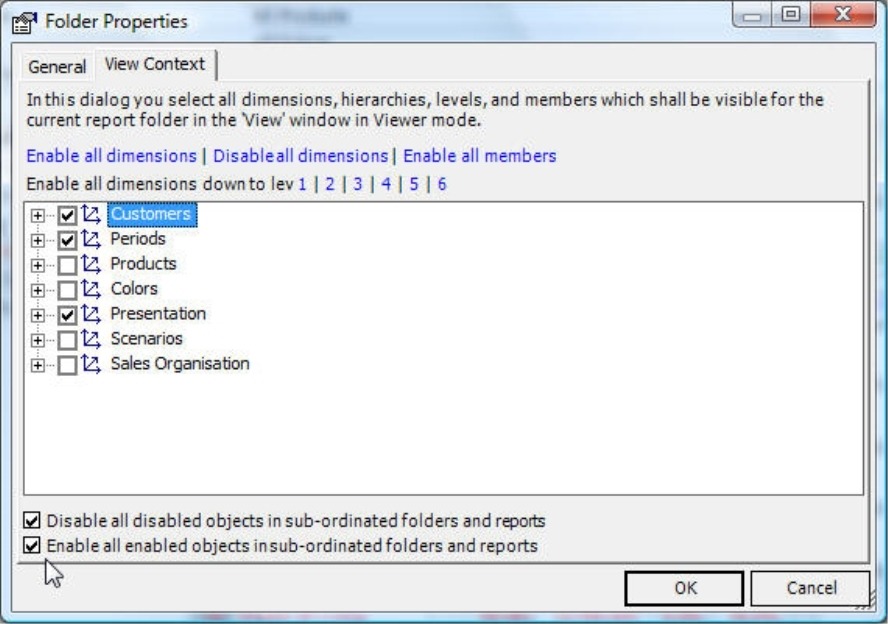
If you want to use the same View context for multiple reports, you can save a tremendous of time by defining this setting in the Folder properties (located in the folder’s context menu in the Briefing book). If you define a View context for a folder, DeltaMaster will automatically apply these settings to the underlying folders and reports. These options are located on the bottom of the dialog box.
If you use this feature, the subordinate objects will not be permanently linked to the folder properties. DeltaMaster will simply enter this selection once in all respective reports and folders. That way, you can alter this ‘default’ setting to apply a different View context to individual reports.
Changing the view of a folder in Viewer mode
Viewer users themselves can use folders to save valuable time as well. If someone working in Viewer mode selects a folder in the Briefing book and then selects a view, DeltaMaster will automatically display this view in all reports and subfolders.
Resourceful Miner, Analyzer and Pivotizer users can utilize this function as well. In order to change the view in all reports of a folder, you simply switch to Viewer mode, select the desired folders in the Briefing book, change the view, and DeltaMaster will automatically make this change in all of the respective reports and subfolders. Afterwards, you can switch back into your preferred user level. In particular, if you want to modify your view in multiple dimensions, this option is much faster than to chose to Refresh the folder (context menu, I want to… menu) to change the report view.
Drill downs in pivot tables
Another way to give Viewer users targeted access to the data model or shield them from unnecessary complexity is to allow them to drill down on pivot tables. If you are working in Pivotizer, Analyzer or Miner in DeltaMaster 5.3.8 or higher, you can determine if users can open or close certain pivot tables or axes in Viewer mode as well. As a result, report editors can determine where (i.e. in which hierarchy or level of detail) users can access additional information and where they cannot.
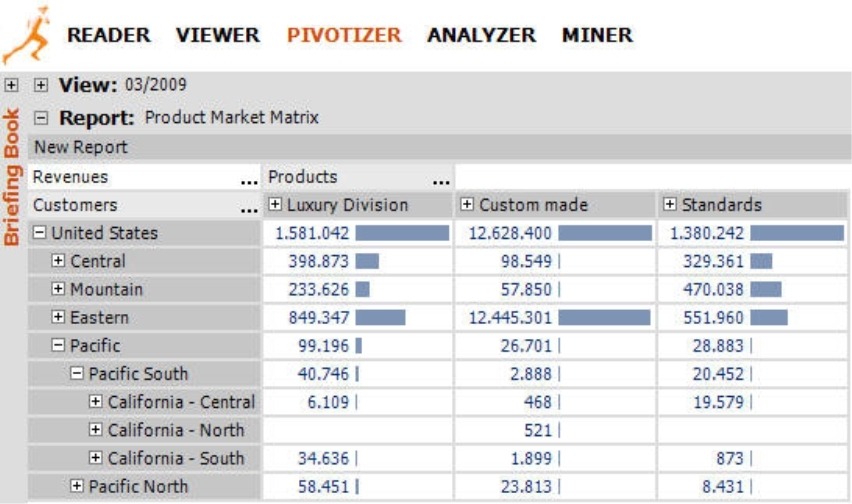
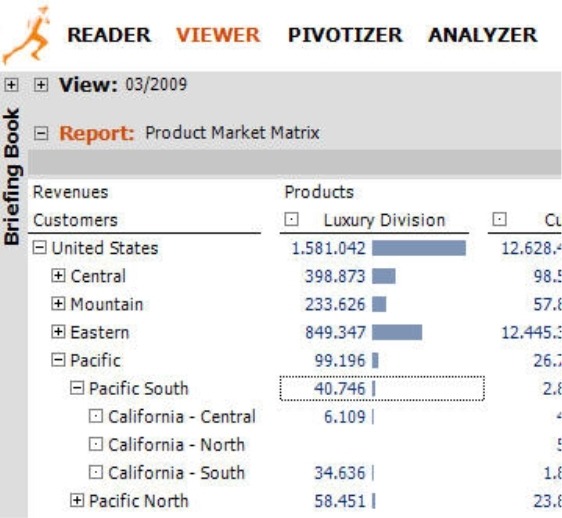
Here’s an example. Let’s assume that you have created a pivot table that shows sales revenues by customers and products.
If your report consumers in Viewer mode don’t need to know the revenues of individual customers, a drill down to states (e.g. California Central etc.) would provide adequate detail. Therefore, you can give them the option to drill down to this level and collapse or expand the individual branches as they wish. Since they don’t need to differentiate among Luxury Division, Custom Made, and Standards, however, you don’t need to enable a drill down by main product groups.
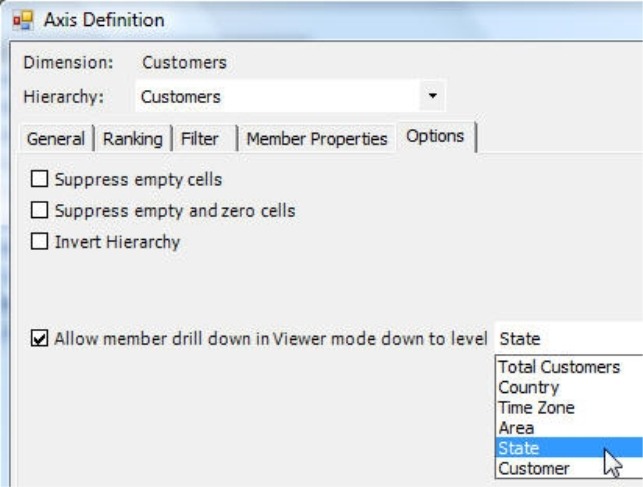
You can make these settings in the respective Axis definition in the pivot table. For the customer dimension, go to the Options tab and enable a drill-down to the level of your choice.
Since you don’t want to allow Viewer users to drill down on the product dimension, you don’t need to alter the settings for this dimension. In other words, you need to activate this feature for each individual pivot table and axis.
If you limit the drill down level in Viewer mode, this will not affect how members are displayed in saved reports. In other words, Viewer users could see members on levels for which they have no drill-down access. If you collapse these branches in Viewer mode, therefore, you will not be able to expand them again. In order to see these branches again, you would have to reopen the report.
And how does this work in Viewer mode? Viewer users will be able to use the plus and minus signs to open and close the customer dimension down to the predefined level. They will not, however, be able to drill down on the product dimension. As a result, each user can determine which level of detail he or she wants to see – within the framework and as determined by the report editor in a higher level.
The drill-down options and the view context controls described above also apply in the DeltaMaster WebOption. That way, you can determine how much flexibility or interactive functionality you want to offer Viewer users from a Web browser.
Automatic presentation in white style
You may have noticed that there are no grid lines, colorful backgrounds or other decorative elements in the screenshot above. DeltaMaster automatically generates this ‘white style’ design and applies it to different user modes.
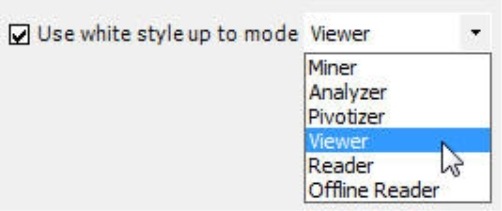
Elements that help users to create reports often distract your consumers in the final presentation. That’s why DeltaMaster hides them so that you don’t have to spend a lot of time removing the unnecessary designs as you would in a spreadsheet. DeltaMaster in versions 5.3.6 and higher applies this white style as the default setting for Reader and Viewer modes. If you go to the Extras menu under Options on the Presentation tab, you can determine up until which user level (starting with Offline reader) you want to Use [the] white style for the current analysis session.
Presenting an open briefing book
Another way to simplify working with all DeltaMaster user modes is to automatically display important folders in your Briefing book whenever anyone opens an analysis session. This way, you can automatically present a folder containing a very interesting overview chart and store the detailed analyses in a closed folder.
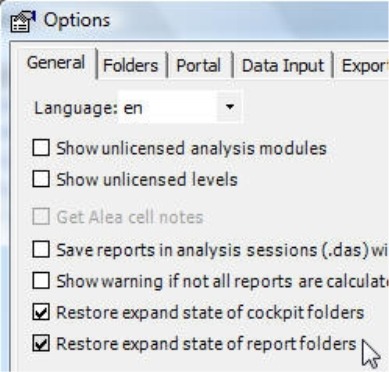
If you want DeltaMaster to note which folders are opened and which are closed in the analysis session, activate the Restore expand state of report folders option under the Extras menu, Options, General).
Defining the start mode
You can define a Start mode for each analysis session (Extras menu, Options, Mode). When you open a session, DeltaMaster will automatically change into this level provided that adequate licenses are available. If you have created an analysis session tailored to Viewer users, DeltaMaster will select this view automatically. Users with appropriate access rights can switch to a higher level at a later time if desired.
Try it yourself!
Even if you generally work with DeltaMaster in Miner or Analyzer mode, it helps to switch down into Viewer mode every now and then to understand how others really see the fruits of your labor. In addition to getting a taste for how your consumers view your briefing books, you’ll also profit from Viewer’s clean, calm interface.
Questions? Comments?
Just contact your Bissantz team for more information!
