Greetings, fellow data analysts!
Complexity and flexibility go hand in hand in controlling applications. For instance, think of the filters with which you set the month, customer group, product group, cost center, etc. to which reports are to refer: The more attributes, the more flexible you can be in configuring a report, but there are also more conditions to keep in mind and understand. DeltaMaster automatically eliminates some things that are created in the database but are not relevant to a report. In addition, it takes business understanding and experience to decide which attributes should be available and which should not. This is a question of responsibility for design, and of leadership. After all, the criteria for control are not based on a whim, but already a decision that the team, the department, and the division have to follow. We explain how you can prepare reports with the filter context – thus managing complexity and facilitating flexibility.
Best regards,
Your Bissantz & Company team
DeltaMaster displays the filter bar above each report. It shows which attributes affect the report as filters, and you can also set the filters there, thus determining the data excerpt that the report is meant to show.
Critical factors in the efficiency of the filter function are which filter attributes are available – and also: how many. Especially in reports intended for many recipients, it is good to have simple settings options: There should be just a few attributes – the most important ones, not as many as possible! This particularly applies if the reports are to be used on mobile devices such as iPhones or iPads, which have to make do with relatively small screens and reduced operation.
Which and how many filter criteria are displayed depends on how the reports were set up. With DeltaMaster, you can determine precisely which attributes should and should not be available. That is good news for everyone who feels that there are too many filter criteria on offer: Report editors can control whether to make work as easy as possible for the report recipients or to grant them maximum freedom. The key to setting up the reports is the filter context. This should always be given special attention.
Dimensions in the filter bar
To explain the adaptation options, we will first explore which attributes are offered in the filter bar in Presentation Mode. Generally, all dimensions from the analysis model are eligible. DeltaMaster goes to great lengths to keep the display as clear as possible. To decide whether a dimension is displayed (and whether this is only in the detailed view or compact view), DeltaMaster applies the following criteria:
a) Linking of measures and dimensions in the analysis model
b) The perspective of the report
c) The filter context of the report
d) The filter setting (view) of the report, i.e. the stored selection of members
e) The setting for visibility of dimension members and levels
We explain these criteria below.
a) Linking of measures and dimensions
In Presentation Mode, DeltaMaster automatically hides dimensions that are not linked with any measure of the current report; they would have had no effect on the report anyway. In Modification Mode, these dimensions are grayed out in the filter bar.
b) Perspective
Since DeltaMaster 6.1.3, it has been possible to group dimensions, hierarchies, levels, members, and measures into “semantic perspectives” when Modeling, thus laying a kind of mask or screen over the analysis model. Then, instead of having to cope with the full complexity of the model, report editors can hide what they don’t currently need. The hidden attributes are no longer accessible to report recipients either, and are not displayed in the filter bar.
c) Filter context
The filter context works in a very similar way, although it is only effective in relation to report recipients. It is used to control which dimensions, hierarchies, levels, and members report recipients should have access to. The settings apply to the compact view and detailed view alike. The filter context is logically sub-ordinate to the perspective: What is already hidden in the perspective cannot be shown again by the filter context.
d) Filter setting (view) of the report
With dimensions that are not hidden because of the mechanisms described above, we distinguish between whether they only appear in the detailed view in the filter bar or also in the compact view (and can therefore be seen by everyone). This primarily depends on which members are selected in the dimensions.
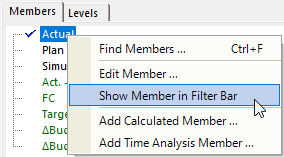
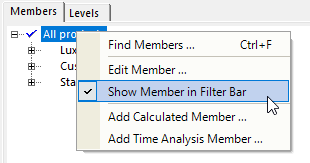
As you will recall, the stylized square at the front in the filter bar is used to switch between the compact view and the detailed view.
![]()
![]()
In the compact view, DeltaMaster shows all dimensions in which something specific is selected – i.e. something other than the standard member. The standard member is usually the “All member“ of a dimension, for example “All customers”, “All products”, “All cost centers”, etc. So, if specific customers, products, cost centers, etc. are selected (and not “all”), DeltaMaster also displays the dimension in the compact view, otherwise only in the detailed view.
The dimensions in the compact view often also include (but not in the screenshot) the “flat” dimensions whose members are all on the same level, such as value type, view of period, cumulation, and scaling. These dimensions have no aggregated members and no non-specific standard member. Instead, something specific is always selected; for example, the members “Actual”, “Current”, “Not cum.”, and “1:1”. Therefore, these members can also be regularly seen in the compact view unless they are hidden, as described in section e) – and as we generally recommend.
e) Setting for visibility of dimension members and levels
When Modeling, you can explicitly stipulate that DeltaMaster, in contrast to the rules in section d), should display or hide specific members. Typical cases for these options are:
- Some specific members are so obvious that they don’t have to be displayed everywhere. With a budgeted income statement, for instance, you would have to point out that it is budgeted; by contrast, if the income statement contains the actuals, you don’t have to state this. Therefore, it is entirely possible to hide members such as “Actual”, “Current“, etc.
- Sometimes, you might also want to display a non-specific “All member“ immediately to indicate that this property is available and can be changed. The default setting of not displaying a dimension if nothing specific is selected is dispensed with, as an invitation to the report recipients to deal with this attribute and select other, specific members.
These options affect all reports in the application. If selected members and dimensions are only to be removed from the filter bar in individual reports, you can work with perspectives; see below.
Filter context of reports
Probably the best-known tool for preparing the filter bar for report recipients is the filter context. Many users are familiar with the concept from DeltaMaster 5 under the name “View context”. This is still in place in DeltaMaster 6. It has simply been renamed “filter context“ and linked with the perspectives.
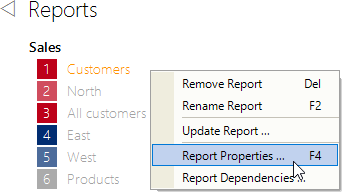
The filter context is one of the Report Properties. In Modification Mode when you edit, these can be accessed via the context menu of reports.
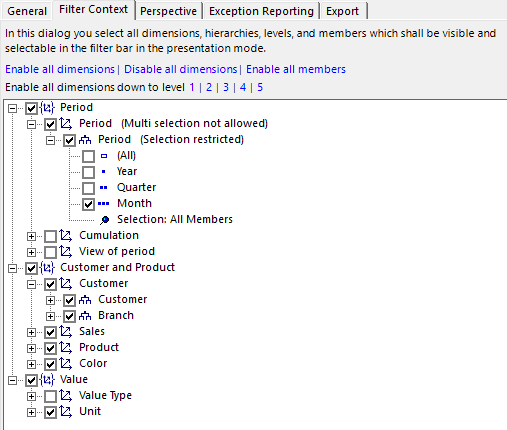
All dimension groups, dimensions, hierarchies, and levels available for this report are displayed in the structure tree. Available means: All dimensions, hierarchies, and levels of the analysis model except those that are already hidden via a perspective.
You can use the checkboxes to stipulate which dimensions, hierarchies, and levels are to be visible and selectable in Presentation Mode (box checked) and which are not (box unchecked).
Take note of hierarchies
The customer dimension in the example shows that two hierarchies are enabled: customer and branch. Experience suggests that it is often because of parallel hierarchies like these that report recipients are confronted with more selection options than they would like. Therefore, our tip is this: When setting the context, take note of the hierarchies as well as the dimensions.
Selecting levels
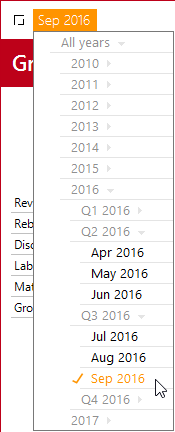
In the period dimension in the example, only one specific level was allowed: month level. In Presentation Mode therefore, the only category of time that can be selected via the menu is months. Years and quarters are grayed out, and can be “drilled down on and rolled up”, but not selected.
This setting is appropriate for reports with a typical monthly representation in which you want to ensure that the reader doesn’t switch to quarter or year level. Often, the time reference has a major impact on the structure and design of reports, so it is advisable to channel the variation options for the report recipients to reflect the intention of the report. In the standard reports generated by DeltaMaster, the filter context is automatically set up in the relevant manner.
With many other attributes, too, it is worth adapting the granularity in the filter bar to the report type or report object. For example, Portfolio Analyses are part of strategic planning, so no daily values are processed in them. And if a Geo Analysis is based on a map that has a resolution of no more than three-digit zip codes, operating errors are prevented by a corresponding reduction in the customer dimension for this report. Adaptations of this kind simplify the interface for report recipients – and remind them that there are clear notions about what you can and can’t do with data.
If levels are excluded, DeltaMaster points this out in the dialog (“Selection restricted“ next to the hierarchy concerned).
Selecting members
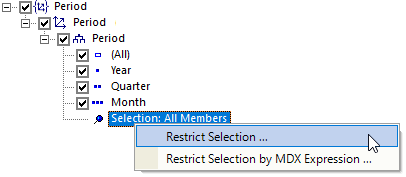
In OLAP databases, the selection options intended to be available in Presentation Mode can also be defined as an individual group of members. The selection below the levels is used for this: Via the context menu, you can restrict the selection via member list (using the Dimension Browser) or via MDX Expression (using the MDX editor).
In principle, you know this logic from the Axis Definition of Graphical Tables: There, you can use Level selection, Member selection (“pick list“), or an MDX expression to determine which members are to feature in the rows and columns of the Graphical Table. The same three constructs can be used to stipulate which members are to be offered in the dimension menu of the filter bar in Presentation Mode.
If a selection of members has been defined, DeltaMaster points this out in the dialog (“Selection restricted“ next to the relevant hierarchy), and the context menus of the hierarchy and of the selection contain a further entry for canceling the restriction. If some hierarchy levels are disabled in addition to the selection of members, the intersection, i.e. only the members that are part of an enabled level, can be selected in Presentation Mode.
Allowing or preventing multi selection
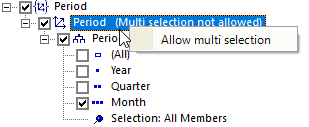
A further, often convenient restriction can be stipulated via the context menu of dimensions: that only precisely one member may be selected in Presentation Mode, not multiple ones. This is obvious in the case of dimensions whose members are not suitable for addition due to their business logic; for example scenarios, value types, or currencies. In the time dimension, too, it is sometimes advisable to suppress multi selection, particularly if the report contains time analysis members that cannot be calculated for multiple periods or are hard to interpret. The standard reports of DeltaMaster with their cumulations and prior-year comparisons are an example of this – and they are also preconfigured accordingly by DeltaMaster in this regard. If Multi selection is not allowed, DeltaMaster shows this in the dialog next to the dimension.
Preselecting filters dynamically
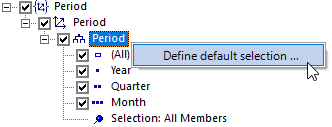
The procedures described above can be used to control which attributes are to be visible to report recipients and interactively selectable. But what should be selected in the starting configuration without users reaching for the mouse and setting a filter themselves, or before they do so? You can define a default selection for this (context menu of hierarchies). What is special about the default selection is that it is dynamic. In the filter context, you store an MDX or SQL expression that DeltaMaster evaluates when the session is opened in order to determine which members are to be (pre)selected at runtime. Various criteria can be taken into account here, such as the current date as per the system time or the current user. This makes the default selection a key tool for reducing the number of reports: Instead of preparing lots of reports that differ only in terms of the filter, you can determine the filter dynamically and apply it to a single report. We will address this in detail in the next issue of clicks!. If a default selection has been defined, DeltaMaster points this out in the dialog (“Default selection defined“ next to the hierarchy concerned).
Perspective and filter context
As mentioned above, semantic perspectives have a very similar effect as the filter context – but in Modification Mode as well as Presentation Mode. In Presentation Mode, the perspective of a report is an additional restriction: Only the selection options that are allowed both in the perspective and in the filter context (tab in the Report Properties) are available to report recipients. In Modification Mode, the perspective affects not only the filter bar, but also, for instance, the definition of the filter context in the Report Properties: Only the dimensions, hierarchies, and levels that have not already been hidden by the assigned perspective can be seen there.
One aspect also makes perspectives particularly efficient when designing the application for report recipients: They can be reused. For instance, if the same dimensions, hierarchies, levels, or members are to be visible and selectable in multiple reports, you can create the corresponding settings once as a perspective (Modeling) and assign them to all relevant reports (Edit, Report Properties, Perspective tab). In this way, the reports are permanently linked with the perspective, and they also adopt subsequent changes automatically.
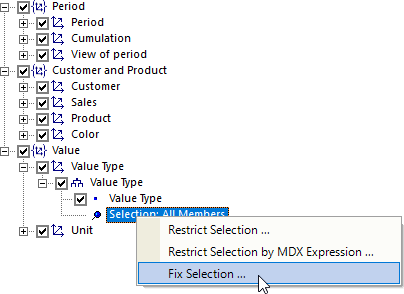
The dialog for defining a perspective (when Modeling) has a very similar structure to the one for the filter context: Perspectives allow you to enable and disable dimensions, hierarchies, and levels via checkboxes, and to select members. In addition, with OLAP databases, it is possible to Fix the selection (context menu of the members). A fixed selection cannot be changed in the filter bar in Modification Mode or Presentation Mode.
Dimensions that are disabled in the perspective are not displayed even if something specific is selected, for example a fixed member. In this way, filters can be made “invisible“ in selected reports.
Working with perspectives is described in DeltaMaster deltas! 6.1.3, feature 9; we will address this again in more detail in a future issue of clicks!.
Filter context of folders
As with reports, a filter context can also be set for folders (via Folder Properties in the context menu of folders). Please note that this initially applies only if the folder itself is selected in Presentation Mode (and not one of the contained reports). If a filter for a folder is amended in Presentation Mode, this change is passed on to all contained reports – a quick way of setting the filters for multiple reports in one go, e.g. to the current month. The attributes to be available for selection for a collective change of this kind are controlled via the filter context of the folder. If all dimensions are disabled, no folder-wide change is possible. This may also be desirable, for instance, in order to prevent inadvertent large-scale changing of the filter if the contained reports are very different.
In addition, the filter context of a folder can be used in order to set the filter context of the contained reports and (sub?)folders. The two additional options below the structure tree are used for this. A distinction is made here between disabling and restrictions on the one hand and enabling on the other. For instance, in the sub-ordinated folders and reports, you can enable (or disable or restrict) everything that is enabled (or disabled or restricted) in the current folder. The corresponding setting is transferred to the sub-ordinated objects when the dialog is closed, once rather than as a permanent inheritance or dependency – as would be the case with perspectives, which might well be the more elegant solution in many cases.
The outcome
With the described procedures, you ensure an uncluttered interface in Presentation Mode and decide which filters can be set. Browsing also relates to this – the dimensions and levels that the Hyper Browser takes into account arise directly from the filter context.
By contrast, the filter context has no direct effect on Navigating. It is possible to offer attributes for Navigating that cannot be selected in the filter bar. The Navigation context is used for designing the navigation attributes; it is described in detail in DeltaMaster clicks! 10/2016 (for reports) and 11/2016 (for measures).
A simple form of a permissions concept can be implemented indirectly through a combination of saved filters and the filter context: by saving a report with filters that users cannot change, or can change only to a limited extent, in Presentation Mode. The differences in relation to database-supported permissions are described in DeltaMaster clicks! 07/2017, including where these are superior.
Making additional selections is easier than deselecting
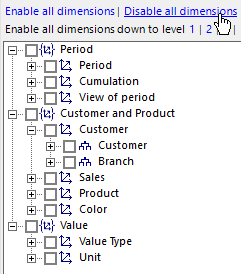
To finish with, here is some advice from experience: Particularly in larger applications with many dimensions and hierarchies, as a report editor, you can sometimes be unsure which ones should remain in the filter context and which ones should be hidden. In this situation, it is often easier if you first disable all dimensions (a link is specially provided for this on the Filter context tab) and then reenable the most important attributes – at least the time (period) and then the most important hierarchy in each case from the few dimensions that constitute the use case, for example customers, products, or cost centers.
Conversely, if you work on the basis of a full selection and painstakingly check dimension by dimension and hierarchy by hierarchy to see whether it might still be needed one day after all for a special evaluation, a relatively large number of attributes are still left over at the end. The 80:20 principle applies here as well: For most users and most tasks, only a few attributes are required. It is therefore worth designing the central, distributed, frequently used reports in such a way that they work with just a few attributes. And for the few users or situations for which many attributes are required, it may be a good idea to generate an additional report as an “expert view”.


