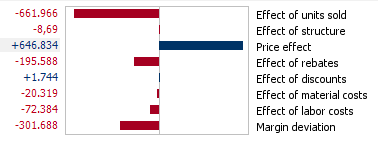
In last week’s blog I introduced the concept of gross margin flow analysis with a typical sales scenario. Where we left off, Sales Region I was criticized for underestimating sales elasticity because the price increase resulted in lower sales. The following analysis was entered as evidence, demonstrating that the positive price effect (€650,000) was offset by the decrease in volume (- €660,000):

Sales Region I, however, knows how to ward off such an attack:

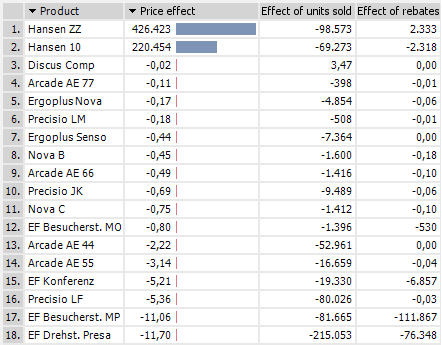
By analyzing the influences on the product level, we can see that prices were only raised for the Hansen product suite. Here, the positive price effects (€ 426,000 and €220,000) are much stronger than the negative effects of the volume decrease (€ 98,000 and €69,000).
Therefore, raising the price was right on the mark. Case closed!
