If you don’t have much to say, you don’t need to use a whole bunch of words – or cups for that matter. An example from the German magazine ‘Wirtschaftswoche’ shows us why.
The following visualization appeared in the June 30, 2008 issue of Wirtschaftswoche. Since then, I have been agonizing why a renowned business publication would invent a currency based on the price of a cappuccino and fill an entire page with 332 cups. Is this supposed to be some kind of Pisa test for business professionals? Is the editorial staff laughing and waiting for the protest letters to pile in? Or is this just Günter Wallraff’s latest coup?
 Click to enlarge. You can also view these 19 graphics as a gallery on Wirtschaftwoche’s Web site.
The cups are all different sizes – but that doesn’t matter. In Cappuccinoland every cup only costs € 1.98 (€ 789.38 /399.5 cups). The prices at Starbucks (€ 3.80), McCafe (€ 2.39) and even at Cafe Meisengeige in Nuremberg (€ 2.10) are all much higher.

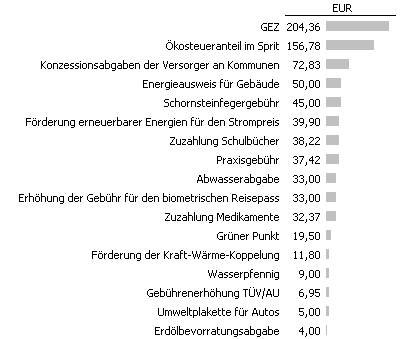
The previous chart was frothed out of this quarter page of data. In case you are interested, the sum of this chart is € 799.13.
According to Wirtschaftswoche, these values do not appear in any official calculation on financial burdens. That’s true. There, however, I would find the German macroeconomic tax and contribution ratio*. And its course shows what we probably already guessed in the first place.
1960: 41.5 %  51.7 % (2008)
[Max 56.3 %]
The editors at Wirtschaftswoche will have to decide for themselves what they are doing. In management reporting, however, we must focus on content and a formal design that guarantees high readability and avoids unnecessary embellishments – like frothed milk on top.
* Click here for more information and the current values (in German).
