You are currently viewing a placeholder content from YouTube. To access the actual content, click the button below. Please note that doing so will share data with third-party providers.
Our forum at Porsche Museum in Stuttgart may be over, but the excitement and enthusiasm are still very strong. And not just for me, but for everyone I have spoken to about it. It was a fabulous day, with outstanding speakers and an eager audience. Our IT and sales orchestrated the setup and organization perfectly, and our development team presented fantastic new innovations.
There are many wonderful words to describe this venue, but “museum” is not one of them. As you approach the building, its floating, monolithic architecture commands respect. What a place! Through its panorama windows, you peer across the rooftops of Stuttgart’s many industries. The floors beneath the conference center house the milestones of technical achievements – and are milestones in the art of presentation themselves. There is no better location to discuss which innovations are possible and necessary in Business Intelligence – and how our client Porsche is steering them in 14 countries!
The in-house technology made the reception and catering areas shine in red and blue. This colorful dichotomy is so important to us because it reflects the luxury that every business professional has to differentiate between values having a positive or negative effect on the business at any time, with just a glance. These colors shape the style of all reports that are generated with DeltaMaster. The “Report Weather” even uses three shades of red and blue to further signalize exactly how positively or negatively they effect the entire report. Some of our clients even hang these six color nuances as a tableau on their walls. Every number sends a signal!
You just couldn’t deny the parallels among the venue’s atmosphere, the functional aesthetics of our DeltaMaster 6 release as well as the colors and forms of our corporate image. That’s not surprising because Porsche Design, a subsidiary of our host, helped shape them.
During the breaks, we were often asked why we sought the help of product – not software – designers for our GUI. The answer is simple. We have turned our backs on the usual design concepts in the software industry a long time ago. That is good thing because every single pixel in our software contains content and meaning, yet still appeals to the human eye when the content lays the foundation for a deeper look in the data. The fact that Windows 10 still uses a 3.5-inch disk for its “Save” icon often triggers an amused smile in an industry, which Bill Gates once scolded (in a promotionally effective way) back in 1998 – the same year that Ferdinard (“Ferry”) Porsche passed away.
Ferry Porsche didn’t foresee the Cayenne and Panamera from trends in data. He planned them using his entrepreneurial vision long before they were first mounted on wheels. This interplay between entrepreneurial vision and data analysis was the theme of our DeltaMaster presentation. Michael Hasenpatt, Commercial Director at Coppenrath & Wiese, addressed this topic in dealing with the 13,400 cows and 560,000 chickens that provide their services to its frozen cake business. The company monitors a huge portion of its daily business and takes prompt appropriate actions – with the award-winning mechanisms of DeltaMaster and just one analytic, navigable report showing variances in gross profit down to the underlying causes in sales or production.
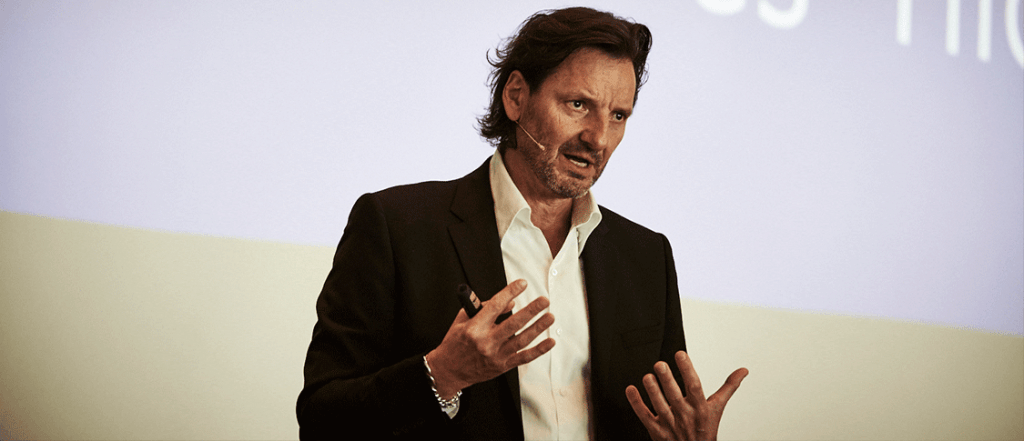
I myself reported on further simplifications in Business Intelligence through radical reductions that focus on the right content and form. Our cooperation with the neurobiologist Gerhard Roth and our research in the lab, top-level competitive sports, and companies over the years have generated insights on how people look, see, and do – and demands disruptive changes in the way we work with data.
Images are highly effective. They slip past the gates of our consciousness. That makes images attractive for advertisers who profit from this rapid fire on the brain. Management accountants, however, cringe when they realize that images are indelible. Unlike a slip of a pen or a tongue, we cannot simply erase them. That is why we must avoid errors in charts at all costs. Scales must be reliable. The necessary knowledge, however, is not generally accessible or publicized. Experts in this field argue even about trivial things. We have introduced new chart formats that counter these dangers.
The highlight of the day came from Tim Waldbauer and Matthias Kauffmann from Porsche AG. They reported on the successes that reflect many of the crystal-clear methods and the performance-driven mindsets [TS1] that you see in all DeltaMaster projects. At Porsche, KPIs are part of a culture where decision-makers look, see, do. After all, you don’t build the best sports cars in the world by chance.
Live demos covering popular topics in the industry rounded out the day. One example was a self-service tool that allows you to quickly transform vehicle registration data from an Excel sheet into a market report and use an app to communicate important signals from that data through an iPhone. The recipients can then zoom and navigate the data on their device to examine it in more detail.
We closed the day with a look in our R&D, where we are working hard to reveal the secrets behind people who look, see, do – and have success in doing it. We focused on our eye-tracking laps with the racing legend Hans-Joachim Stuck. You weren’t in Stuttgart? Sorry you missed it! But we will soon post a video update on our exciting new findings.
Sincerely,
NB


