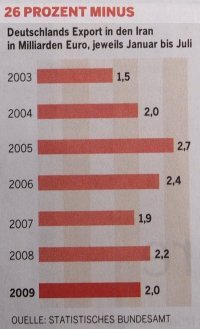
Time only runs top down in sandglasses. But not in charts. There, time is from left to right. Because it’s like that. Take a chart with a horizontal x-axis and a vertical y-axis. The independent variable should always be on the x-axis. Then everybody knows: The dependent variable is on the y-axis. That’s helpful. Like most other conventions, too.
In the newspaper WAMS, the time is vertical. Not too bad. But also not very nice.

Source: Welt am Sonntag, Nr. 40, 04/10/2009, p. 36. Title: 26 percent minus. The German export to the Iran in billions of Euro, January to July for each year
