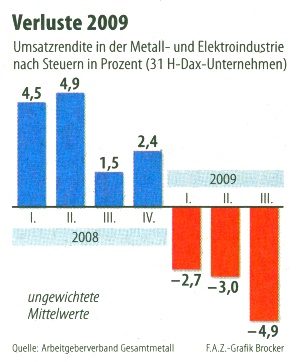
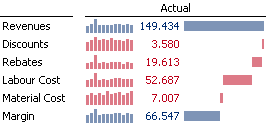
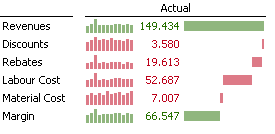
I was tough on red. It’s a signal for bad. What do we use for good? Green? Possible. Blue? Possible, too. I am generous with colors for good. Thus, this chart is okay. (Not the numbers: aggregated without weights.)

Source: FAZ, No. 288, 2009-11-12, page 11. Revenue margins in the metal and electronic industry after taxes in percent (31 H-DAX companies).
I am careful with green. Just because something is above zero it’s not always good. That’s what you think with green. Mostly.


