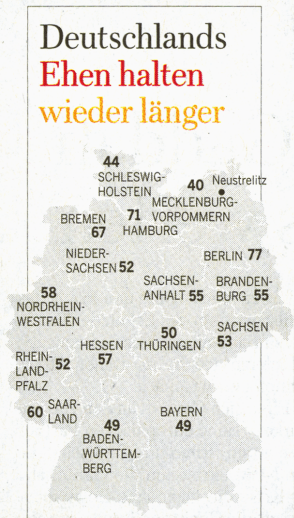
Great. German marriages are increasingly stable. Even better: the graph in the German newspaper „Welt am Sonntag (WamS)“. It’s creator also lives in the deaf dog area. That’s where you are immune against any kind of chartjunk. No coloring of areas with confusing legends. No 3D-bars. Neither a church, nor a wedding dress or an attorney’s robe as decoration.
A small dot and a name, Neustrelitz, the only location which is addressed in the accompanying text. Marriages are most stable in Neustrelitz. Only 8.5 divorces per 1000 residents.
All state borders as clear as necessary while as thin as possible. A thin, narrow spaced font for compact labels. Finally, a small visual goody in the headline.

A graph without any chartjunk
