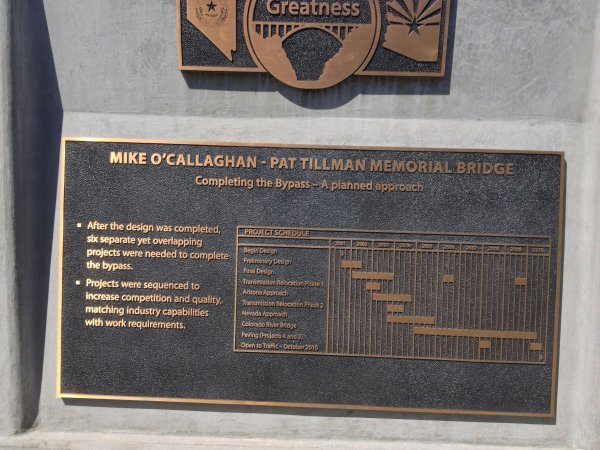
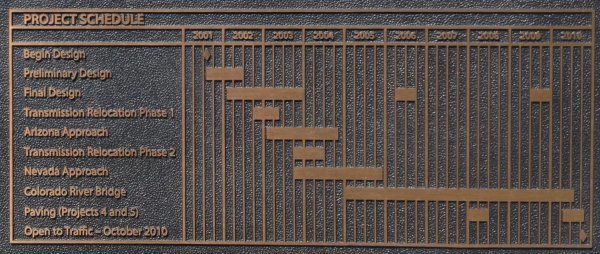
He has been at the Hoover Dam. On the bridge, in front of it. There was a chart. In bronze. A real Gantt-chart. With time periods for construction phases. Casted in bronze. A chart for eternity.

It has taken ten years to build the bridge. The construction the longest. The design has taken long, too. Nice chart.

Gantt charts are good for simultaneous things. Projects, for example. Like this one. Simple and good. Also on paper or with pixel.
