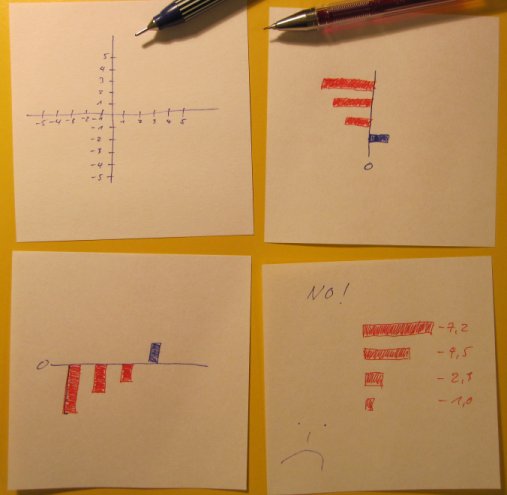
Drawing charts is geometry. Like in school. In a coordinate system. With zero in the center. Negative values to the left. Or at the bottom. Positive values to the right. Or at the top. Negative values at the bottom are more dramatic than negative values to the left. Negative to the right is forbidden. Not even if all values are negative.
It´s odd if geometry is turned upside down. And it´s hard to understand, too. You might disagree with costs and expenses. But not with weightings.

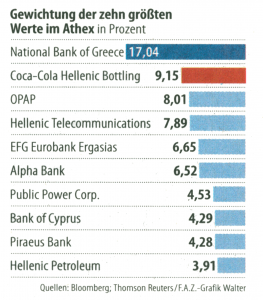
Source: FAZ, No 288, 11 December 2009, page 11. Weighting in percent of the ten largest stocks in Athex (Greek stock index)

