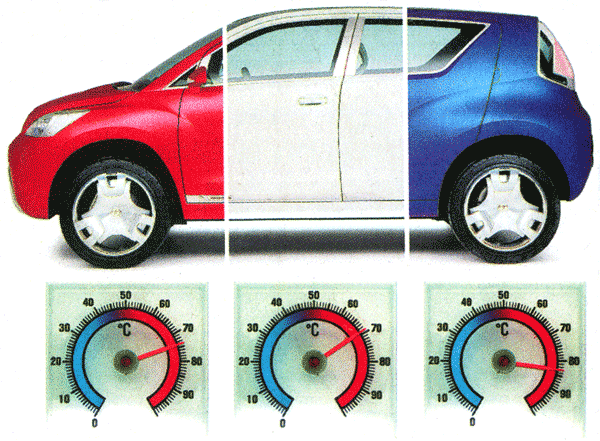
My friend Chiara has sent me a graph about car colors and color as an attribute. From the German newspaper “Nürnberger Nachrichten”. It’s about the temperature dogs have to endure when in summer they have to wait in a car. Definitely too hot. A special case of small multiples. It emphasizes the differences in varnish variants. Sad: the temperature is hard to read. Red needle on a red scale. Tiny marks. Uff. And each gauge uses much too much space. Numbers would’ve been much better. Directly on the varnish.
Colors could have been sorted from left to right according to temperature. White, red, blue. Interesting: the cool blue is much warmer than the hot red. I rate this graph A-.

Temperature comparison of varnish colors.
