CiAgICA8IS0tIExpbmtlZEluIC0tPgogICAgPHNjcmlwdCB0eXBlPSJ0ZXh0L2phdmFzY3JpcHQiPgogICAgICAgIF9saW5rZWRpbl9wYXJ0bmVyX2lkID0gIjEyMzUwNzMiOwogICAgICAgIHdpbmRvdy5fbGlua2VkaW5fZGF0YV9wYXJ0bmVyX2lkcyA9IHdpbmRvdy5fbGlua2VkaW5fZGF0YV9wYXJ0bmVyX2lkcyB8fCBbXTsKICAgICAgICB3aW5kb3cuX2xpbmtlZGluX2RhdGFfcGFydG5lcl9pZHMucHVzaChfbGlua2VkaW5fcGFydG5lcl9pZCk7CiAgICA8L3NjcmlwdD48c2NyaXB0IHR5cGU9InRleHQvamF2YXNjcmlwdCI+CiAgICAgICAgKGZ1bmN0aW9uKCl7dmFyIHMgPSBkb2N1bWVudC5nZXRFbGVtZW50c0J5VGFnTmFtZSgic2NyaXB0IilbMF07CiAgICAgICAgICAgIHZhciBiID0gZG9jdW1lbnQuY3JlYXRlRWxlbWVudCgic2NyaXB0Iik7CiAgICAgICAgICAgIGIudHlwZSA9ICJ0ZXh0L2phdmFzY3JpcHQiO2IuYXN5bmMgPSB0cnVlOwogICAgICAgICAgICBiLnNyYyA9ICJodHRwczovL3NuYXAubGljZG4uY29tL2xpLmxtcy1hbmFseXRpY3MvaW5zaWdodC5taW4uanMiOwogICAgICAgICAgICBzLnBhcmVudE5vZGUuaW5zZXJ0QmVmb3JlKGIsIHMpO30pKCk7CiAgICA8L3NjcmlwdD4KICAgIDxub3NjcmlwdD4KICAgICAgICA8aW1nIGhlaWdodD0iMSIgd2lkdGg9IjEiIHN0eWxlPSJkaXNwbGF5Om5vbmU7IiBhbHQ9IiIgc3JjPSJodHRwczovL3B4LmFkcy5saW5rZWRpbi5jb20vY29sbGVjdC8/cGlkPTEyMzUwNzMmZm10PWdpZiIgLz4KICAgIDwvbm9zY3JpcHQ+CiAgICA8IS0tIEVuZCBMaW5rZWRJbiAtLT4KICAgIA==
Generic filters
Exact matches only
Search in title
Search in excerpt
Search in content

Understatement overdone

Standard & Poor’s gives Japan bad marks. AA- instead of AA. Japan spends more than it earns. And it is too old. That’s what this diagram in the Journal wants to show.
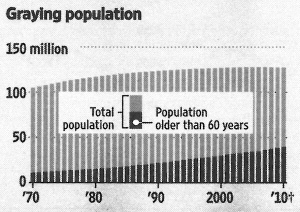
Graying population. - Source: Wall Street Journal Europe, 2011-01-28, page 15.
Quelle: Source: Wall Street Journal Europe, 2011-01-28, page 15.

Count the pixels. The older population grows three times higher. The total population just 20 percent. Even so both series look equally steep. Or flat. Because: Comparing two developments over time is hard. On different levels even harder. We’ve known that for a long time. It applies to proportions, too.

Here we can understand what S&P meant. Because: This diagram shows the proportion only. In comparison to other proportions. And not to itself.
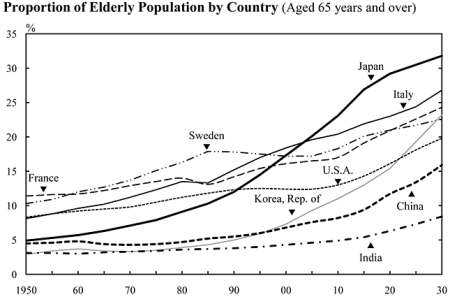
Proportion of Elderly Population by Country (Aged 65 years and over). - Quelle: Statistics Bureau of Japan (Hrsg.), The Statistical Handbook of Japan 2010,Chapter 2: Population.
Quelle: Statistics Bureau of Japan (Hrsg.), The Statistical Handbook of Japan 2010, Chapter 2: Population. Here Sixty-Five-Year-Olds and a longer period. Doesn’t matter.

Nicolas Bissantz

Diagramme im Management

Besser entscheiden mit der richtigen Visualisierung von Daten

Erhältlich im Haufe-Onlineshop.