CiAgICA8IS0tIExpbmtlZEluIC0tPgogICAgPHNjcmlwdCB0eXBlPSJ0ZXh0L2phdmFzY3JpcHQiPgogICAgICAgIF9saW5rZWRpbl9wYXJ0bmVyX2lkID0gIjEyMzUwNzMiOwogICAgICAgIHdpbmRvdy5fbGlua2VkaW5fZGF0YV9wYXJ0bmVyX2lkcyA9IHdpbmRvdy5fbGlua2VkaW5fZGF0YV9wYXJ0bmVyX2lkcyB8fCBbXTsKICAgICAgICB3aW5kb3cuX2xpbmtlZGluX2RhdGFfcGFydG5lcl9pZHMucHVzaChfbGlua2VkaW5fcGFydG5lcl9pZCk7CiAgICA8L3NjcmlwdD48c2NyaXB0IHR5cGU9InRleHQvamF2YXNjcmlwdCI+CiAgICAgICAgKGZ1bmN0aW9uKCl7dmFyIHMgPSBkb2N1bWVudC5nZXRFbGVtZW50c0J5VGFnTmFtZSgic2NyaXB0IilbMF07CiAgICAgICAgICAgIHZhciBiID0gZG9jdW1lbnQuY3JlYXRlRWxlbWVudCgic2NyaXB0Iik7CiAgICAgICAgICAgIGIudHlwZSA9ICJ0ZXh0L2phdmFzY3JpcHQiO2IuYXN5bmMgPSB0cnVlOwogICAgICAgICAgICBiLnNyYyA9ICJodHRwczovL3NuYXAubGljZG4uY29tL2xpLmxtcy1hbmFseXRpY3MvaW5zaWdodC5taW4uanMiOwogICAgICAgICAgICBzLnBhcmVudE5vZGUuaW5zZXJ0QmVmb3JlKGIsIHMpO30pKCk7CiAgICA8L3NjcmlwdD4KICAgIDxub3NjcmlwdD4KICAgICAgICA8aW1nIGhlaWdodD0iMSIgd2lkdGg9IjEiIHN0eWxlPSJkaXNwbGF5Om5vbmU7IiBhbHQ9IiIgc3JjPSJodHRwczovL3B4LmFkcy5saW5rZWRpbi5jb20vY29sbGVjdC8/cGlkPTEyMzUwNzMmZm10PWdpZiIgLz4KICAgIDwvbm9zY3JpcHQ+CiAgICA8IS0tIEVuZCBMaW5rZWRJbiAtLT4KICAgIA==
Generic filters
Exact matches only
Search in title
Search in excerpt
Search in content

You must not chop

Again. My law of proportion. The idea of a chart is: Display proportions between values with proportions of length. Proportional. Proportional. Proportional. You can ignore it. You can also lick out an empty bowl. If you are a rather dumb dog.

I yowled on cheating grids for time axis already. They manipulate. This one is even more elaborate. At first glance you think: a nice man, admits he hasn’t got the data. Wrong. He says: “I tease you but I admit it”. Remove 2001. It suggests that 2002, 2003, 2004, 2005 have been the same as 2001. Were they, really?
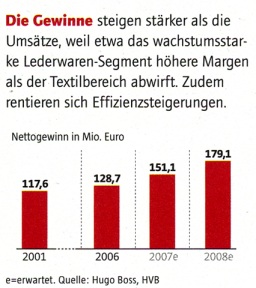
Source: Euro 06/07, p. 42.

This is Howard’s rule „Ignore the visual metaphor altogether” in action. The data doesn’t fit on paper but I show it. A graph doesn’t fit on your paper? Use a table.
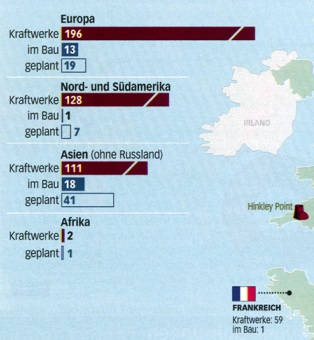
Source: Wirtschaftswoche 27, 2008-06-30, p. 82.

I like „Die Süddeutsche“. Its the first newspaper with graphic tables in the stock market section. And now this. The most interesting information – the outliers, the hotshots and the losers, that what you need to know: hidden. I’ll be on vacation.
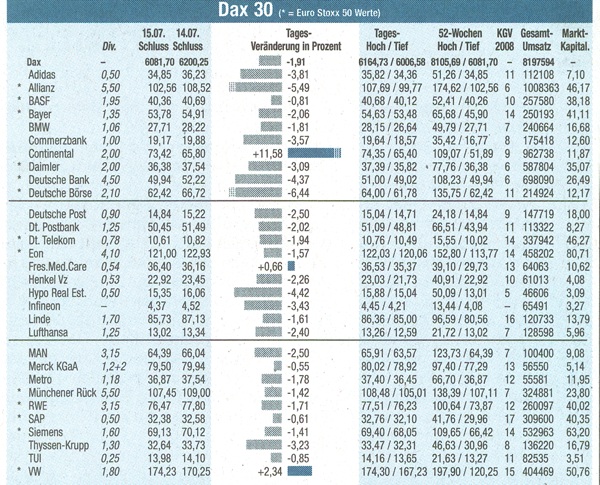

Süddeutsche Zeitung, 2008-07-16.

Nicolas Bissantz

Diagramme im Management

Besser entscheiden mit der richtigen Visualisierung von Daten

Erhältlich im Haufe-Onlineshop.